The Slippery Slope
Slope initially began as a blog, so this is where most of the website’s content resides. Here we have tens of thousands of posts dating back over a decade. These are listed in reverse chronological order. Click on any category icon below to see posts tagged with that particular subject, or click on a word in the category cloud on the right side of the screen for more specific choices.
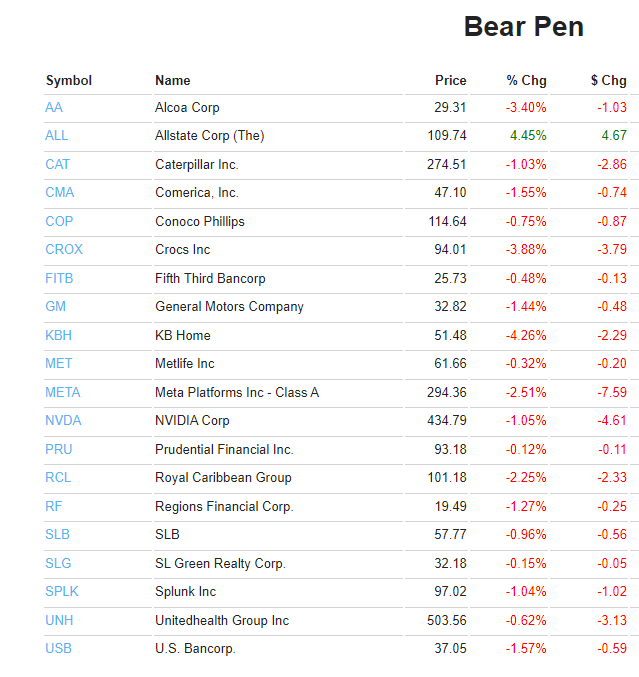
It’s hard not to want to get used to days like this. Remember, you can get any of your watch lists mailed to you for free by going to this page.
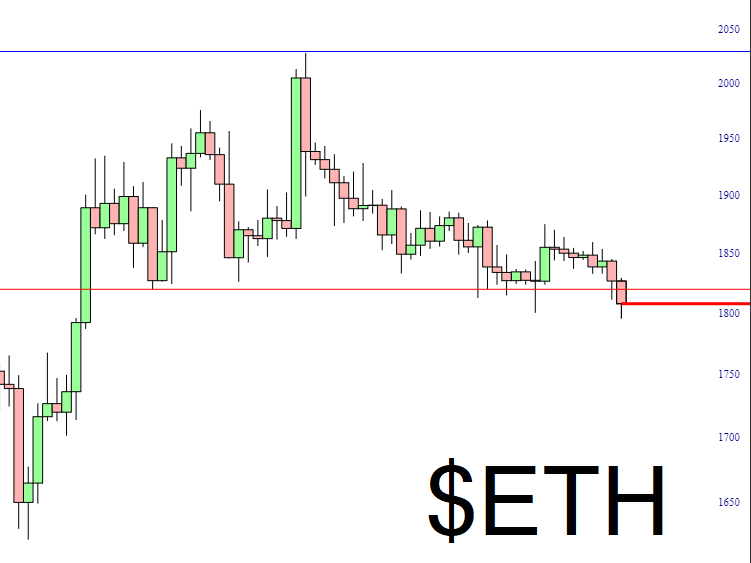
It may seem unrelated to equities, but it never is. Assets tend to move together. Thus, the breakdown of Ethereum is yet another thing that’s going to be helpful to me and the two other bears on the entire planet.
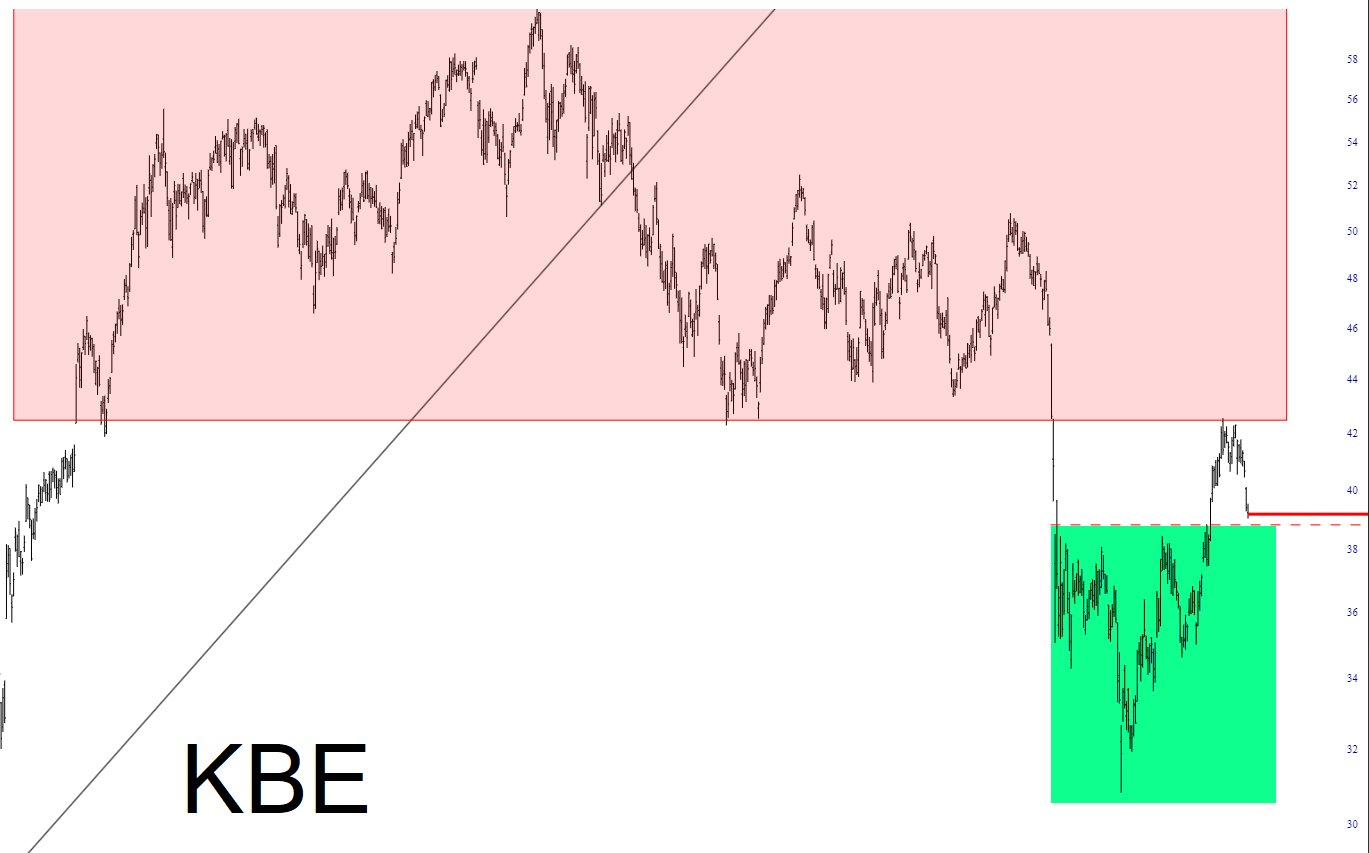
The topping pattern for the banks (in pink: duh) was massive and following, appropriately, by a plunge. After it had fallen hard, the banks were saved by that swine Yellen and her schemes and pushed right up against overhead supply. At that point, they began to reverse, and now they are back to the bottom of the “drop zone“. The question is: will KBE re-penetrate the green tinted zone, or will it find new strength from here and remain range-bound?
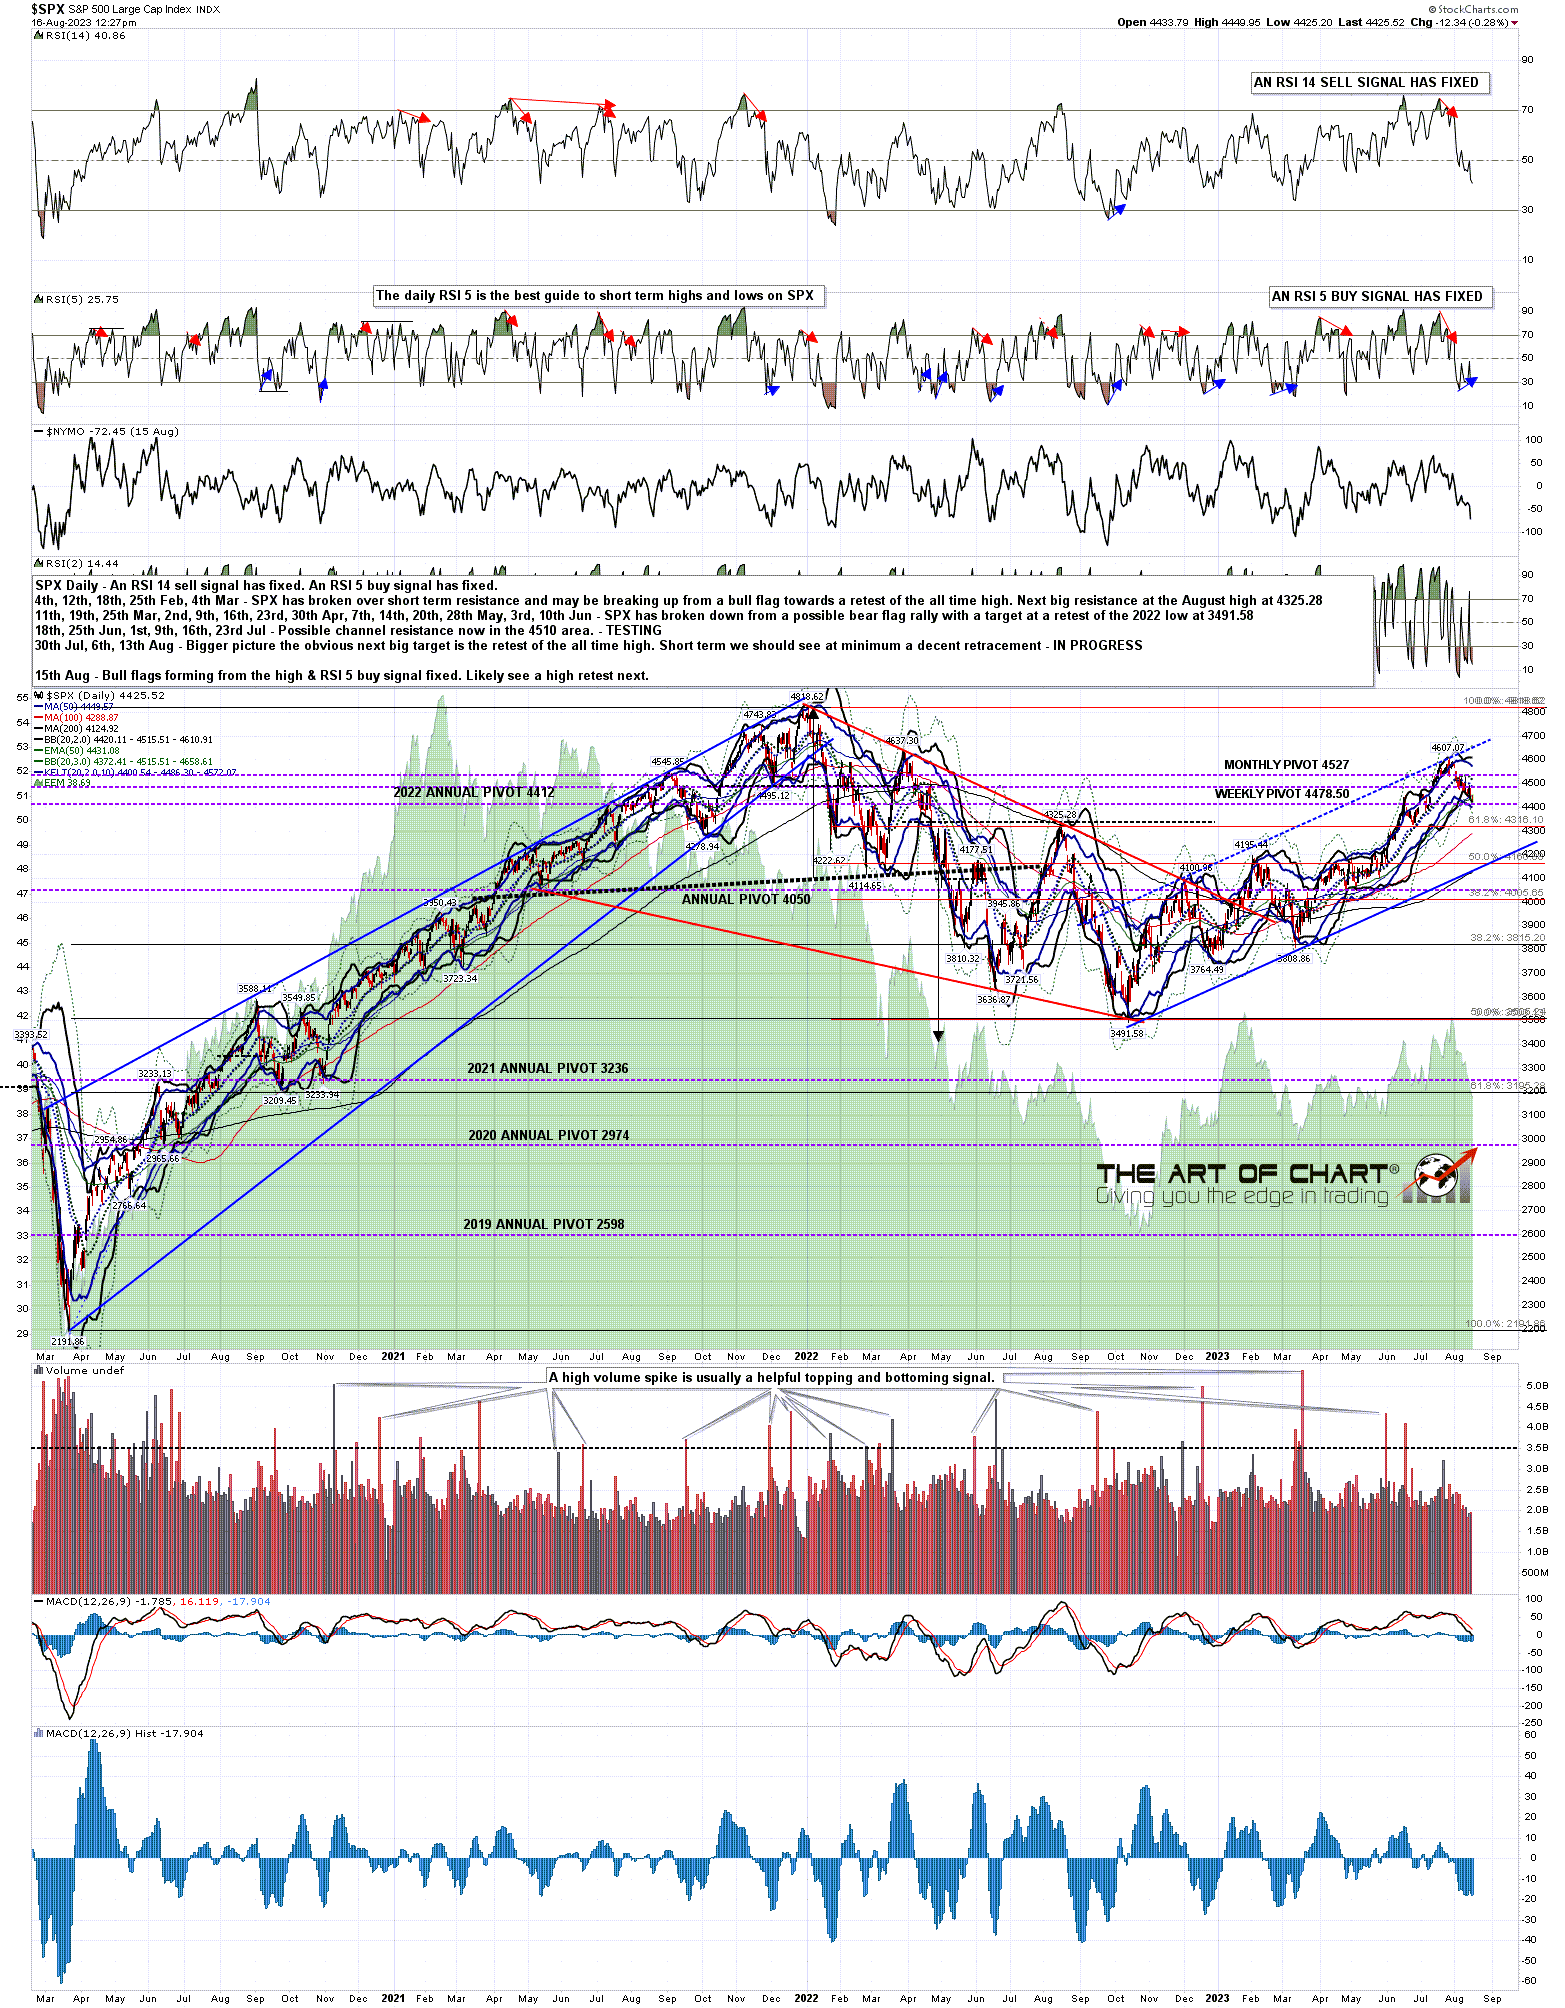
SPX has seen a decent retracement from the highs, the reversion to the mean target at the 45dma has been hit, and a lot of decent looking bull flags have been forming on US indices. SPX may now be close to a retracement low, and a daily RSI 5 buy signal fixed a couple of days ago. The overall setup here is strongly suggesting that the next move on SPX may be a retest of the 2023 high at 4607.07.
SPX daily chart: