
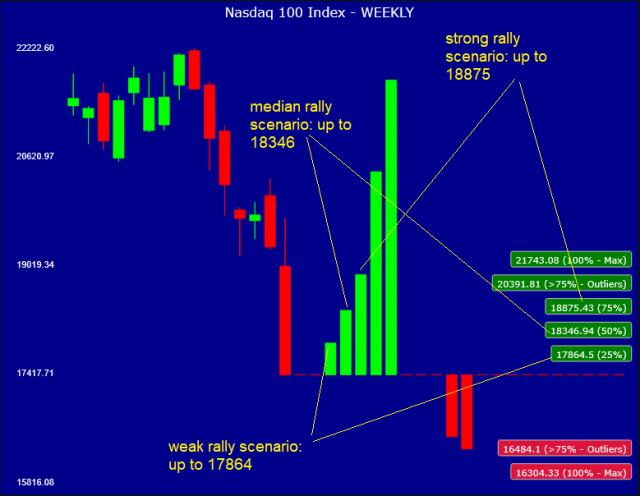
It looks like the market may try to rally already this week. If that happens, it’s quite probable that the rally will be short-lived (at least until the current black cloud persists…). So, if the rally is a Bear Market Rally, these models below may help to determine “how far” these rallies can go. These are WEEKLY models, so as a minimum the time horizon is 1 week (or multiples of that), but things are happening VERY fast at the moment, so I would not be surprised to see a 1-week rally and it may even end on Wednesday.
All this said, here are the targets to monitor, to go SHORT again and profit from the next leg down:

Some additional comments:
- the levels could be reached in the middle of the week and they are valid for trading at that point, but in reality they should be evaluated at the close, because the model uses close prices to calculate trends and probabilities of reversal. In any case in real life practice is OK to use the levels when they are reached, even in the middle of the week, especially if they are >50% probability.
- if you wait for the WEEKLY Close (on Friday) you get a higher chance to place a bet that has possibly a higher chance of success, also because the passing of time (+1 week) increases the chance for reversal, but of course you may miss a better price that was available in the middle of the week. Today, for example, the SPX peaked at 5246, just 3 points above the 5243 level (50% prob. of reversal), then pulled back. The NDX peaked at 18191, that was a bit below the NDX 50% prob. resistance level at 18346.
I hope this helps.
Note from Tim: As I've mentioned to premium members already, the author of this above post, Nico, is someone I've been collaborating with for quite some time, and we're considering introducing a version of the product shown above to Slope. I strongly encourage you to leave feedback and questions in the comments section for Nico!
