
Resistance and Support
Today GOOG will release is earnings, the stock is rallying at the moment, I would like to show you the model applied to GOOG, to identify resistance targets for SHORT GOOG trades.

Here below we can see the distribution of the events (price and time models) when the stock was rallying in past, following a “trend pattern” similar to the one identified by my algorithm today:
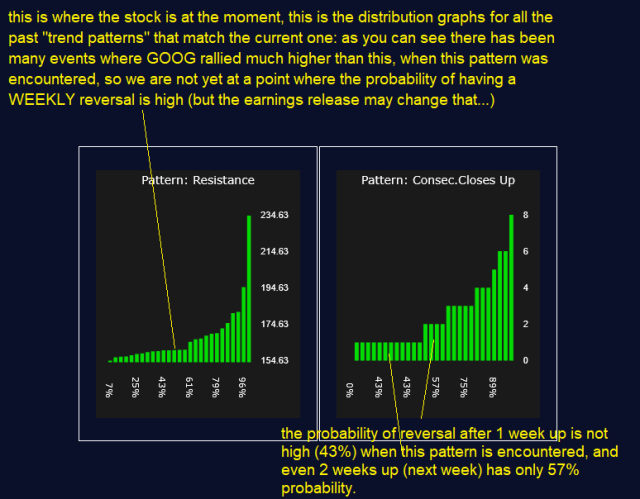
The conclusion is simple: GOOG does NOT appear overbought WEEKLY, the models are saying it could rise higher, possibly for 1-2 more weeks.
Of course this has to be confirmed by the earnings: if the earnings are not good, then the stock may fall.
Another thought: the magnificent 7 can be used as a proxy for the general market direction, given their large market cap in the major US indices. IF GOOG has room to go higher (according to the model), AND IF the earnings are good, AND IF there are no other shocks coming from external factors, then this could indicate that the whole stock market can rise higher, not just GOOG.
We’ll know soon!
