
Back in my post on 11th April I called the likely start of a strong rally which we then saw.
Back in my post on 12th May I called for new all time highs on Bitcoin (BTCUSD) and laid out possible IHS scenarios on both Solana (SOLUSD) and Ethereum (ETHUSD), looking for ideal right shoulder lows on Solana in the 125.43 area and on Ethereum in the 2074.27 area. That hasn’t gone quite as I drew then but essentially both are still running that scenario.
Back in my post on 23rd June I called the likely lows on those right shoulders made on Solana at 126.09 and on Ethereum at 2113.65, and was looking for that IHS scenario on both to start to play out.
Back in my post on 18th July I was looking at the IHS that had since broken up on Ethereum and the progress made towards the IHS neckline on Solana.
In my last post on 22nd July I was looking for some retracement after the IHS on Solana had broken up, and looking also at the possibility that a setup for a hard fail might form in that retracement.
Did we see that topping sequence on Solana form? Well we saw the retracement start as expected, but there was no retest on Solana to set up daily signals, so I’m currently just seeing the current pullback as a likely retracement before going higher, subject to the equity markets, as if they reverse the full move from the April lows, Crypto would likely do the same.
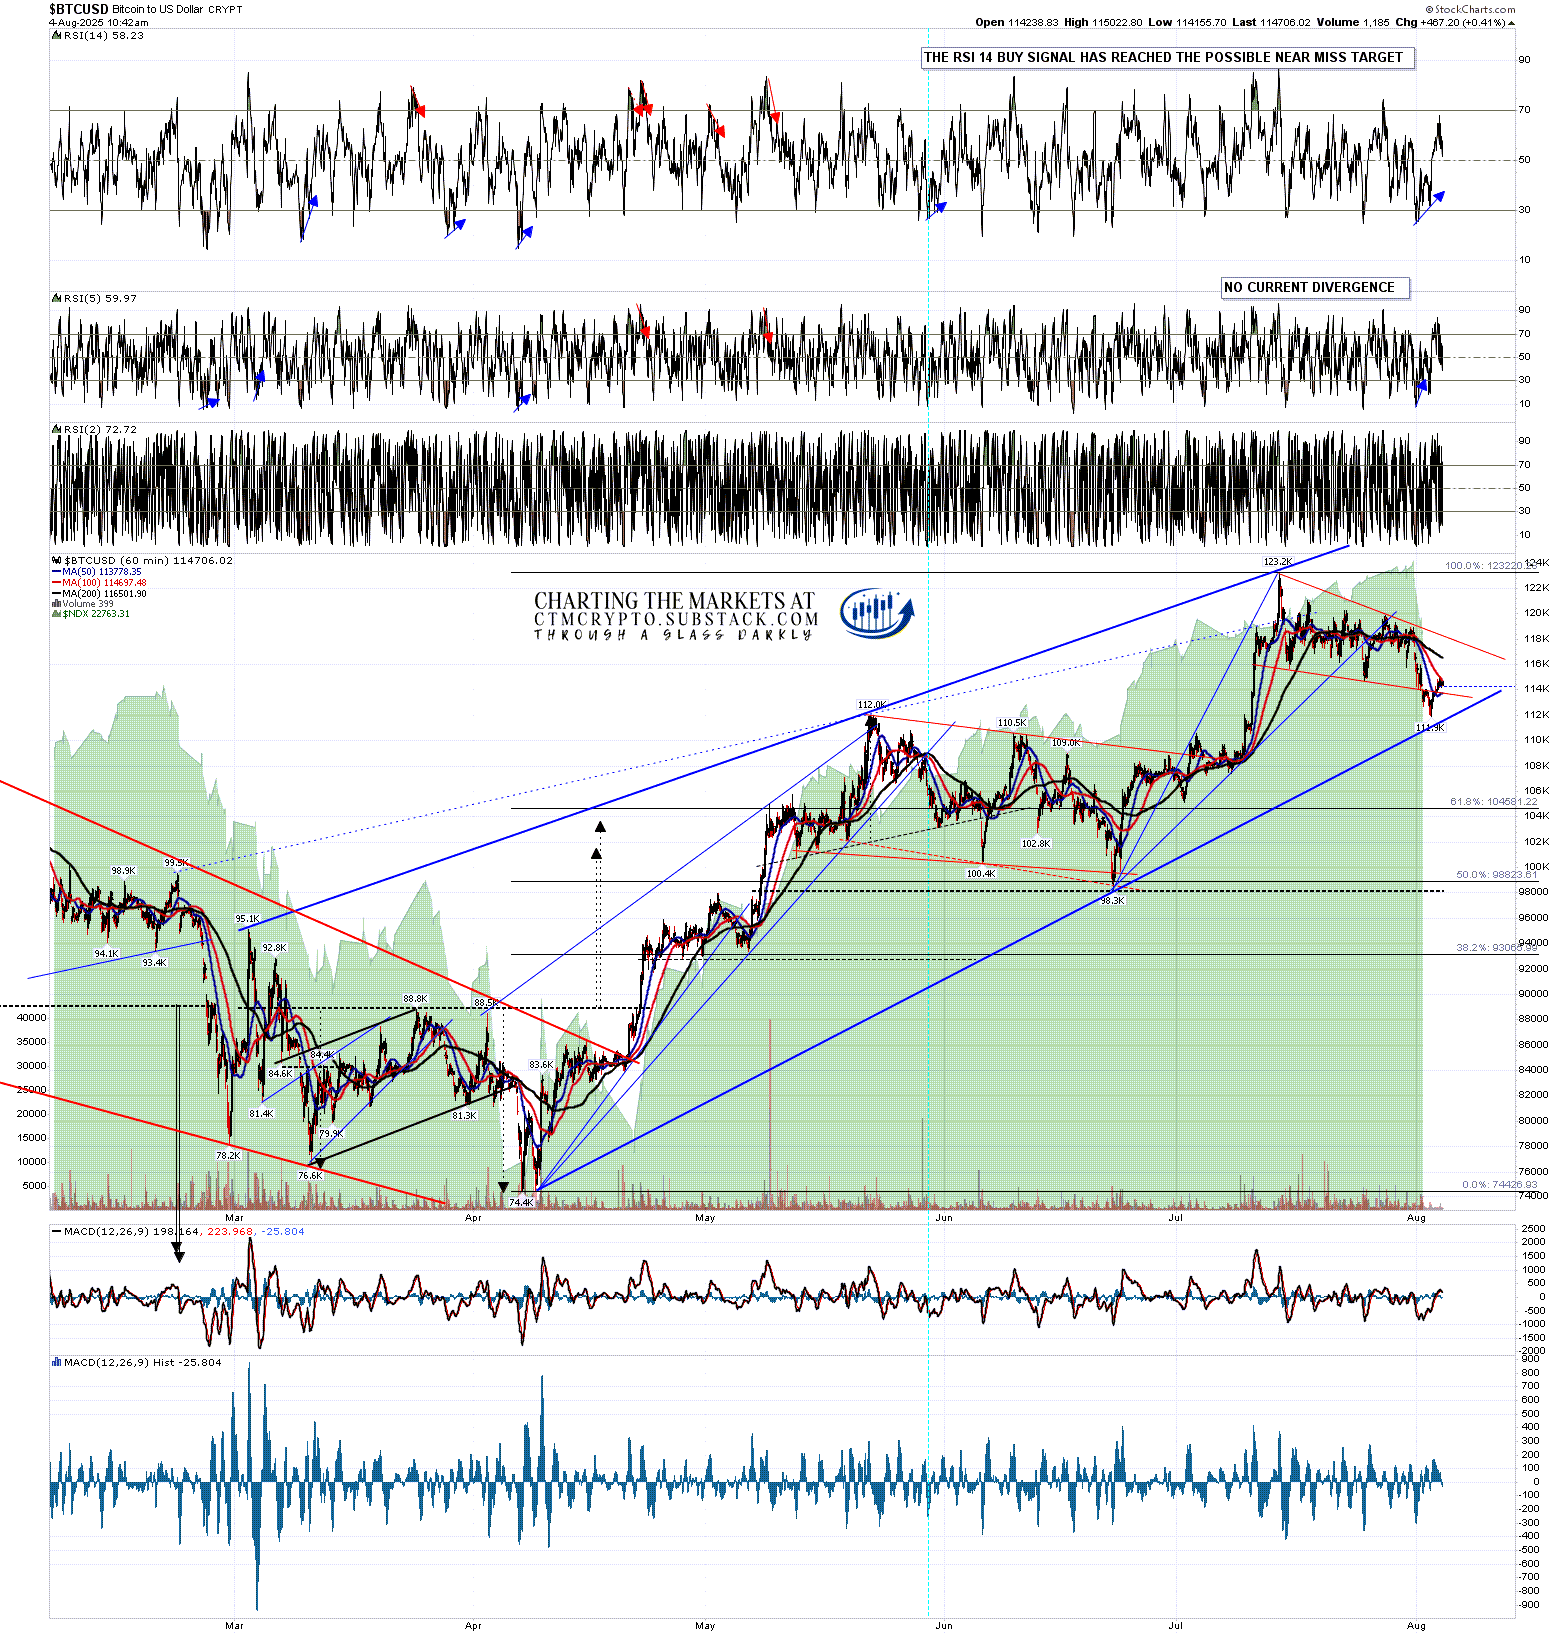
Looking at Bitcoin first the rising wedge I was looking at in my last post has come close to a test of the rising wedge support trendline, currently at 112k. The pattern from the high may well be a bull flag forming but I’m thinking that wedge support may well break and, if so, I’d be watching the 38.2% and 50% retracement levels in the 104.5k and 98.8k areas respectively.
BTCUSD 60min chart:
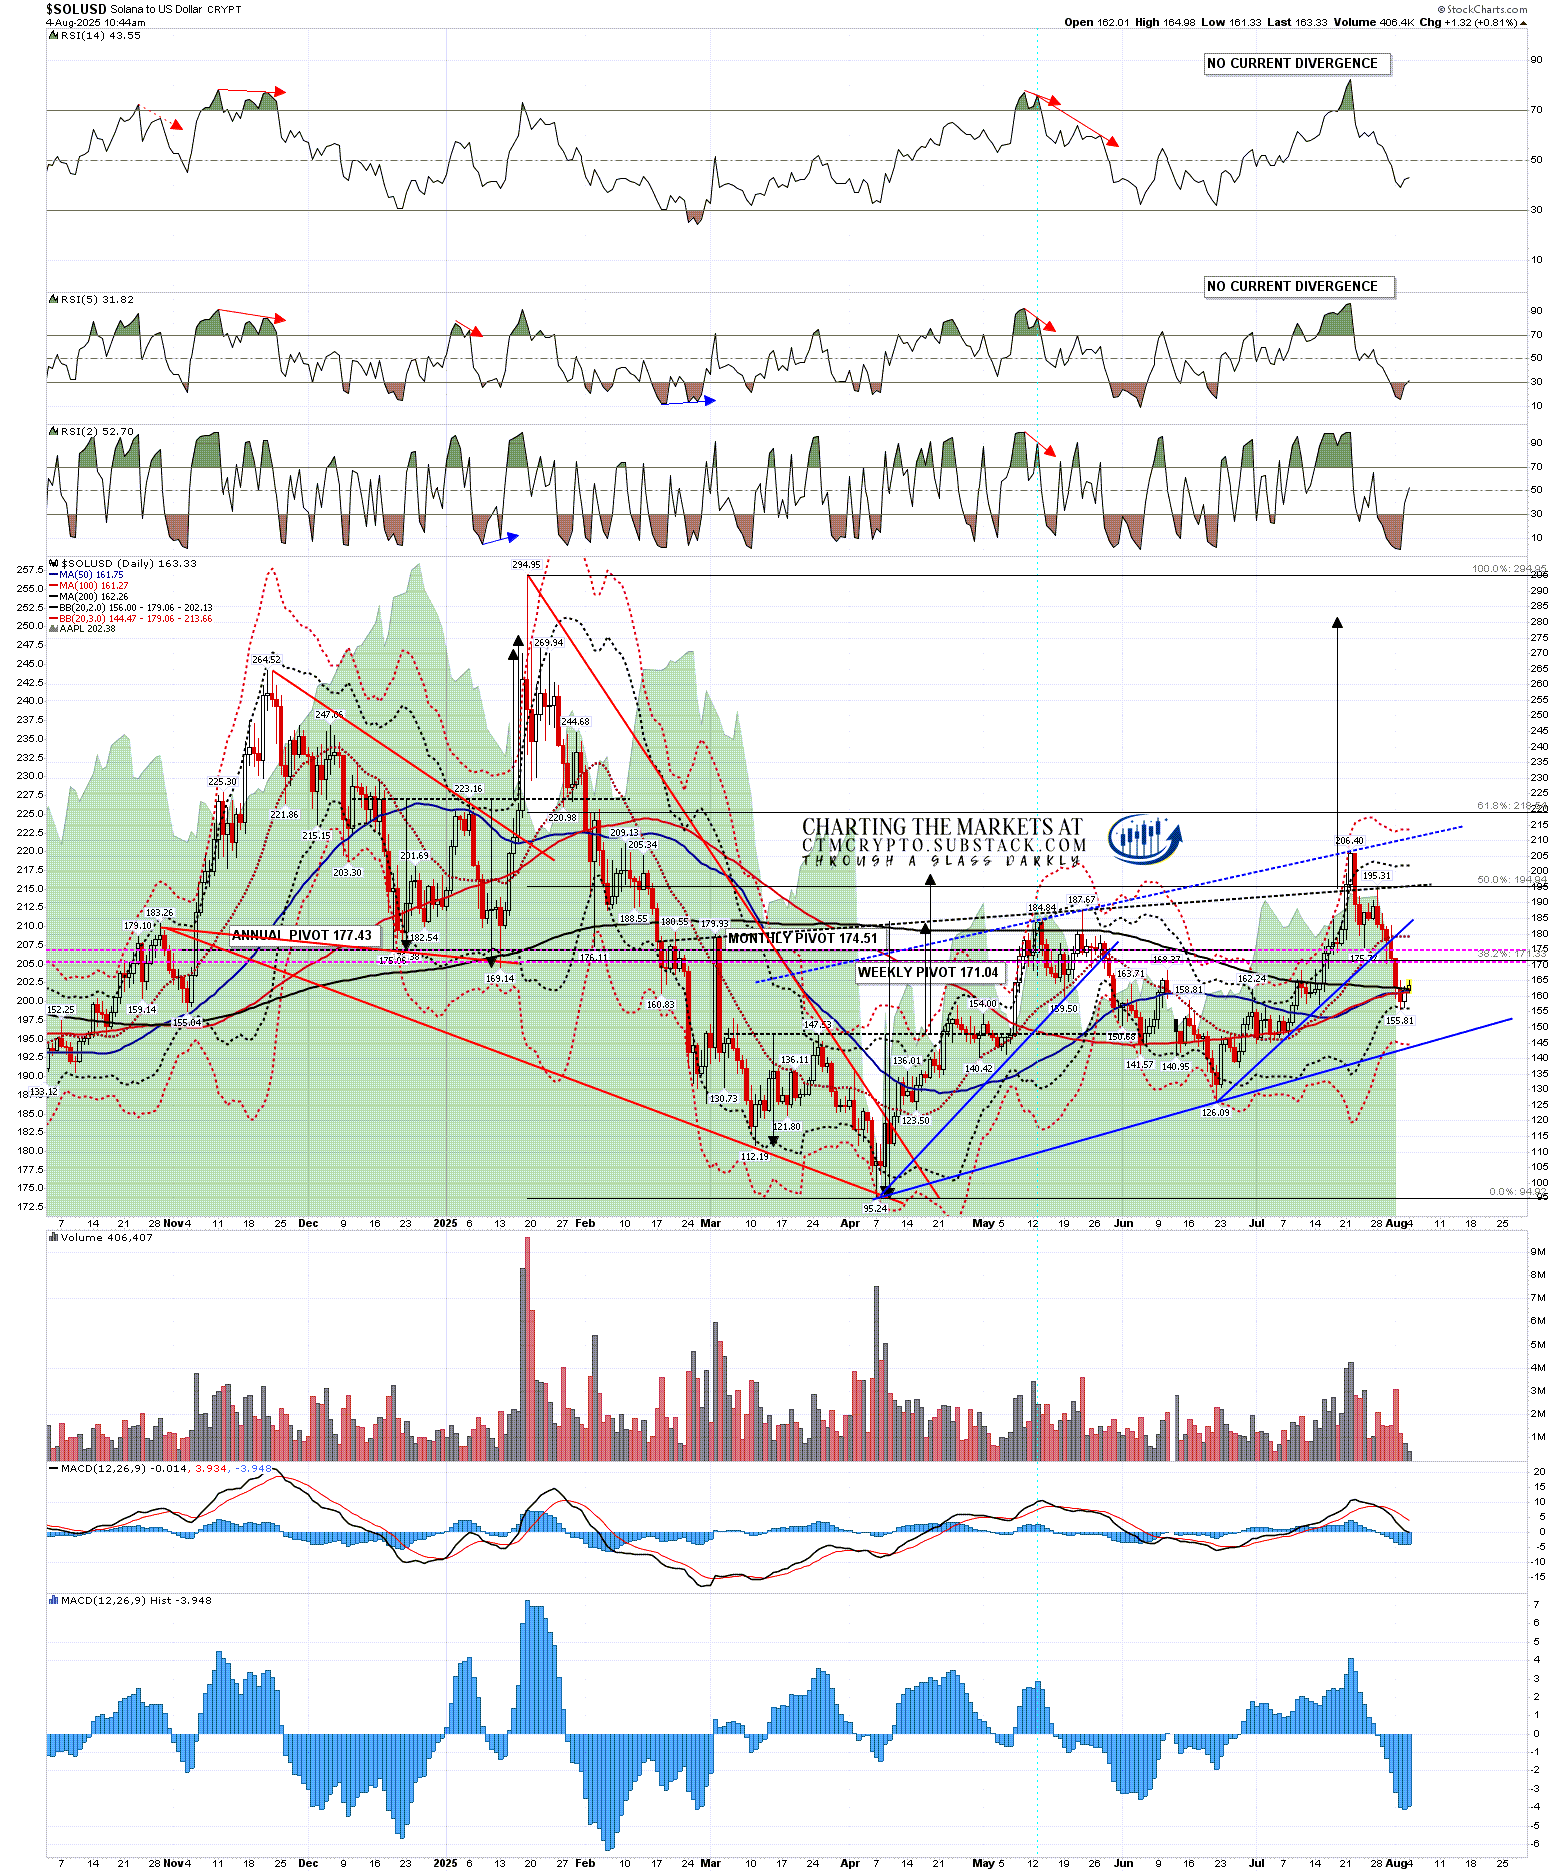
On the Solana daily chart the IHS broke up with a target in the 285 area but I’m still considering the possibility that the IHS may fail. That failure would be on a move that breaks the right shoulder low at 126.09 and would trigger a target at a retest of the April low at 95.24.
There are no daily signals fixed and I’m watching the rising support trendline from the April low, which on a hard fail could be bear flag rising wedge support. That rising support is now in the 147 area.
SOLUSD daily chart:
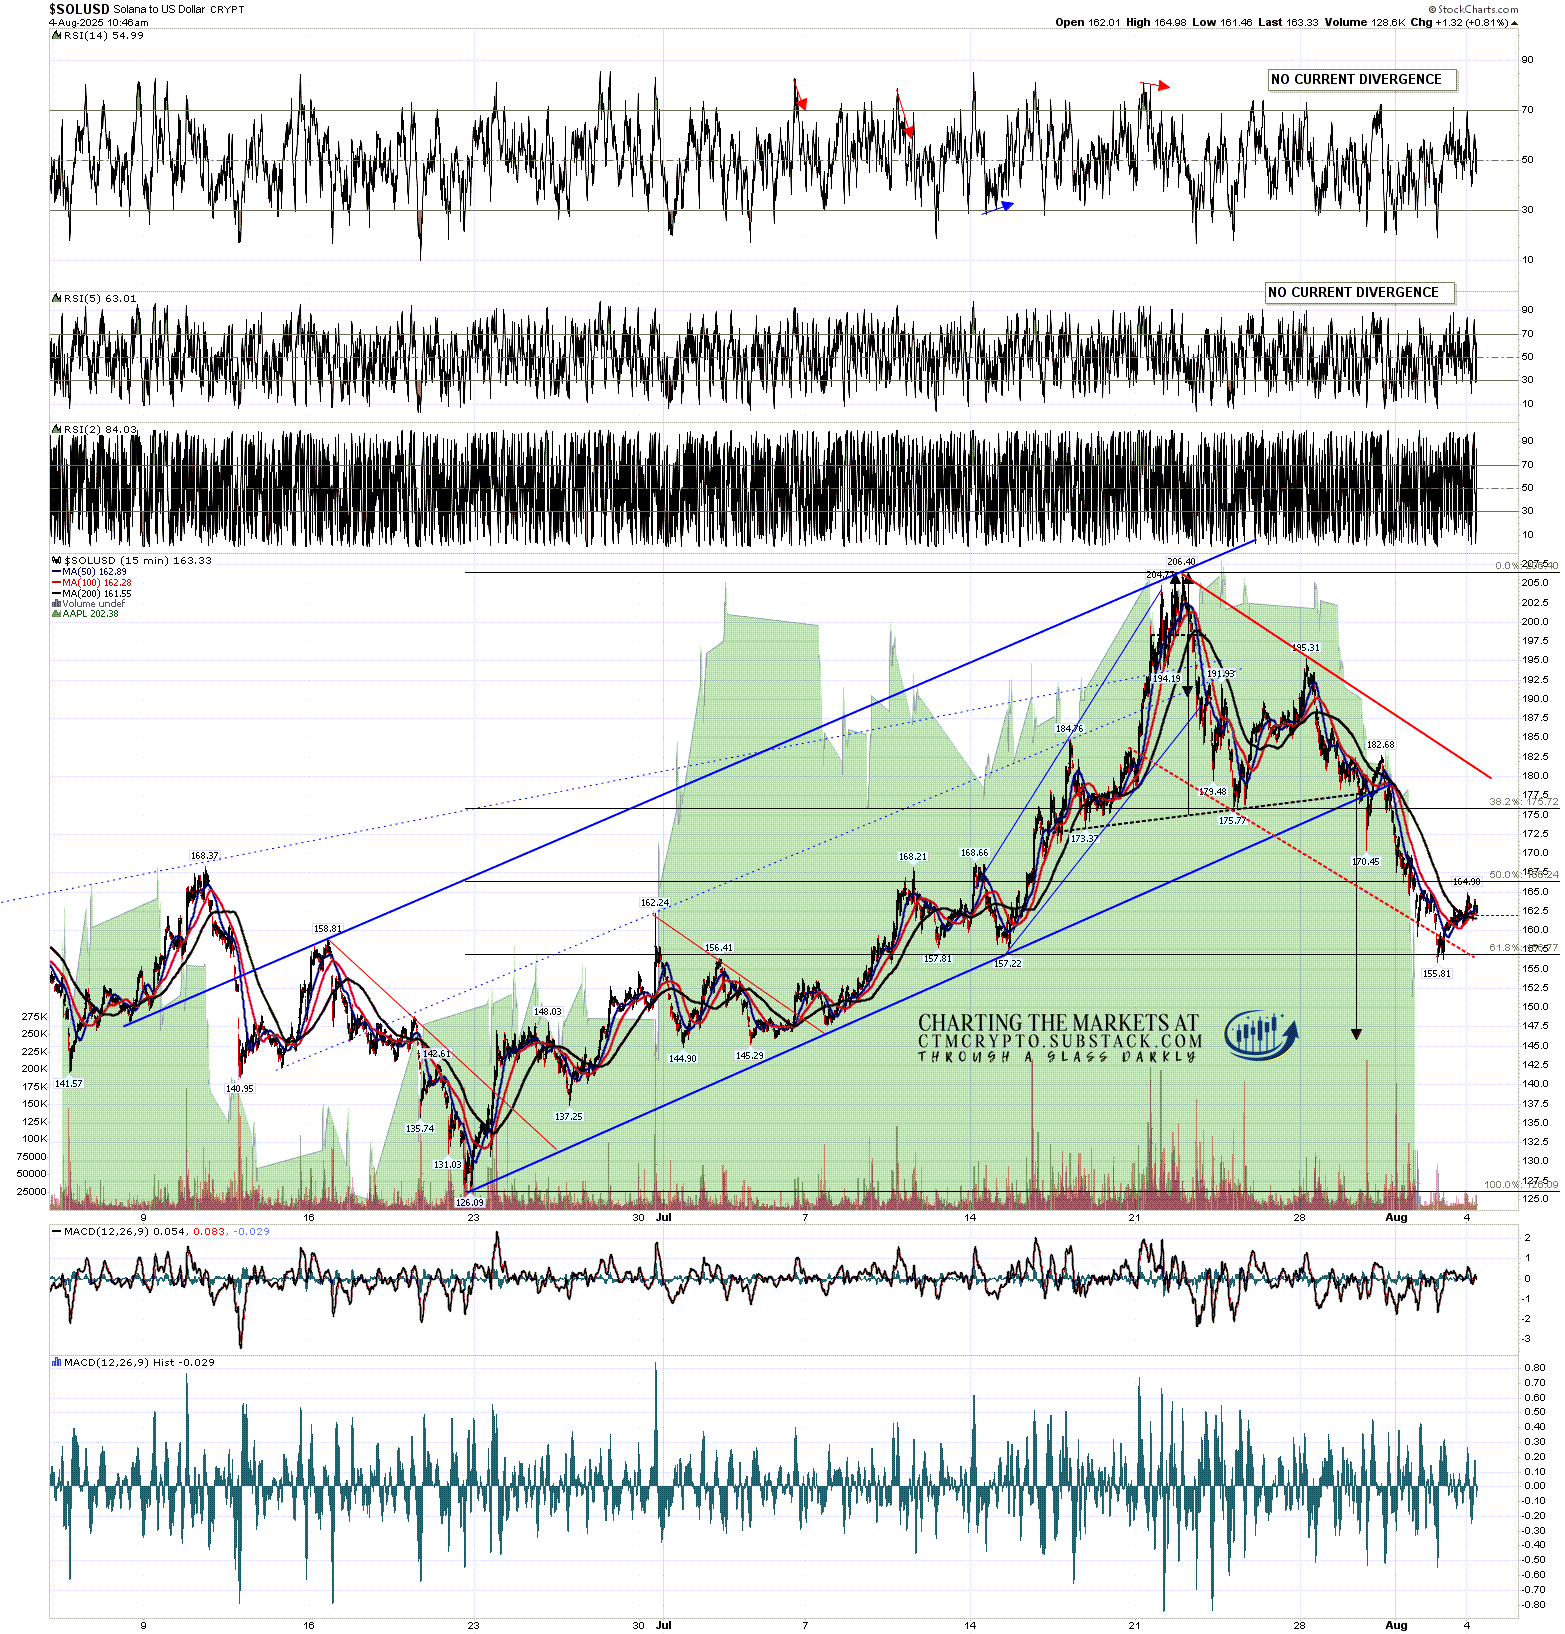
Looking at the 15min chart Solana has broken down from an H&S with a target in the 147 area, currently a strong match with the rising support trendline on the daily chart and, given that I’m also expecting at least another leg down on equity indices in the near future, I like the odds of that H&S reaching target.
SOLUSD 15min chart:
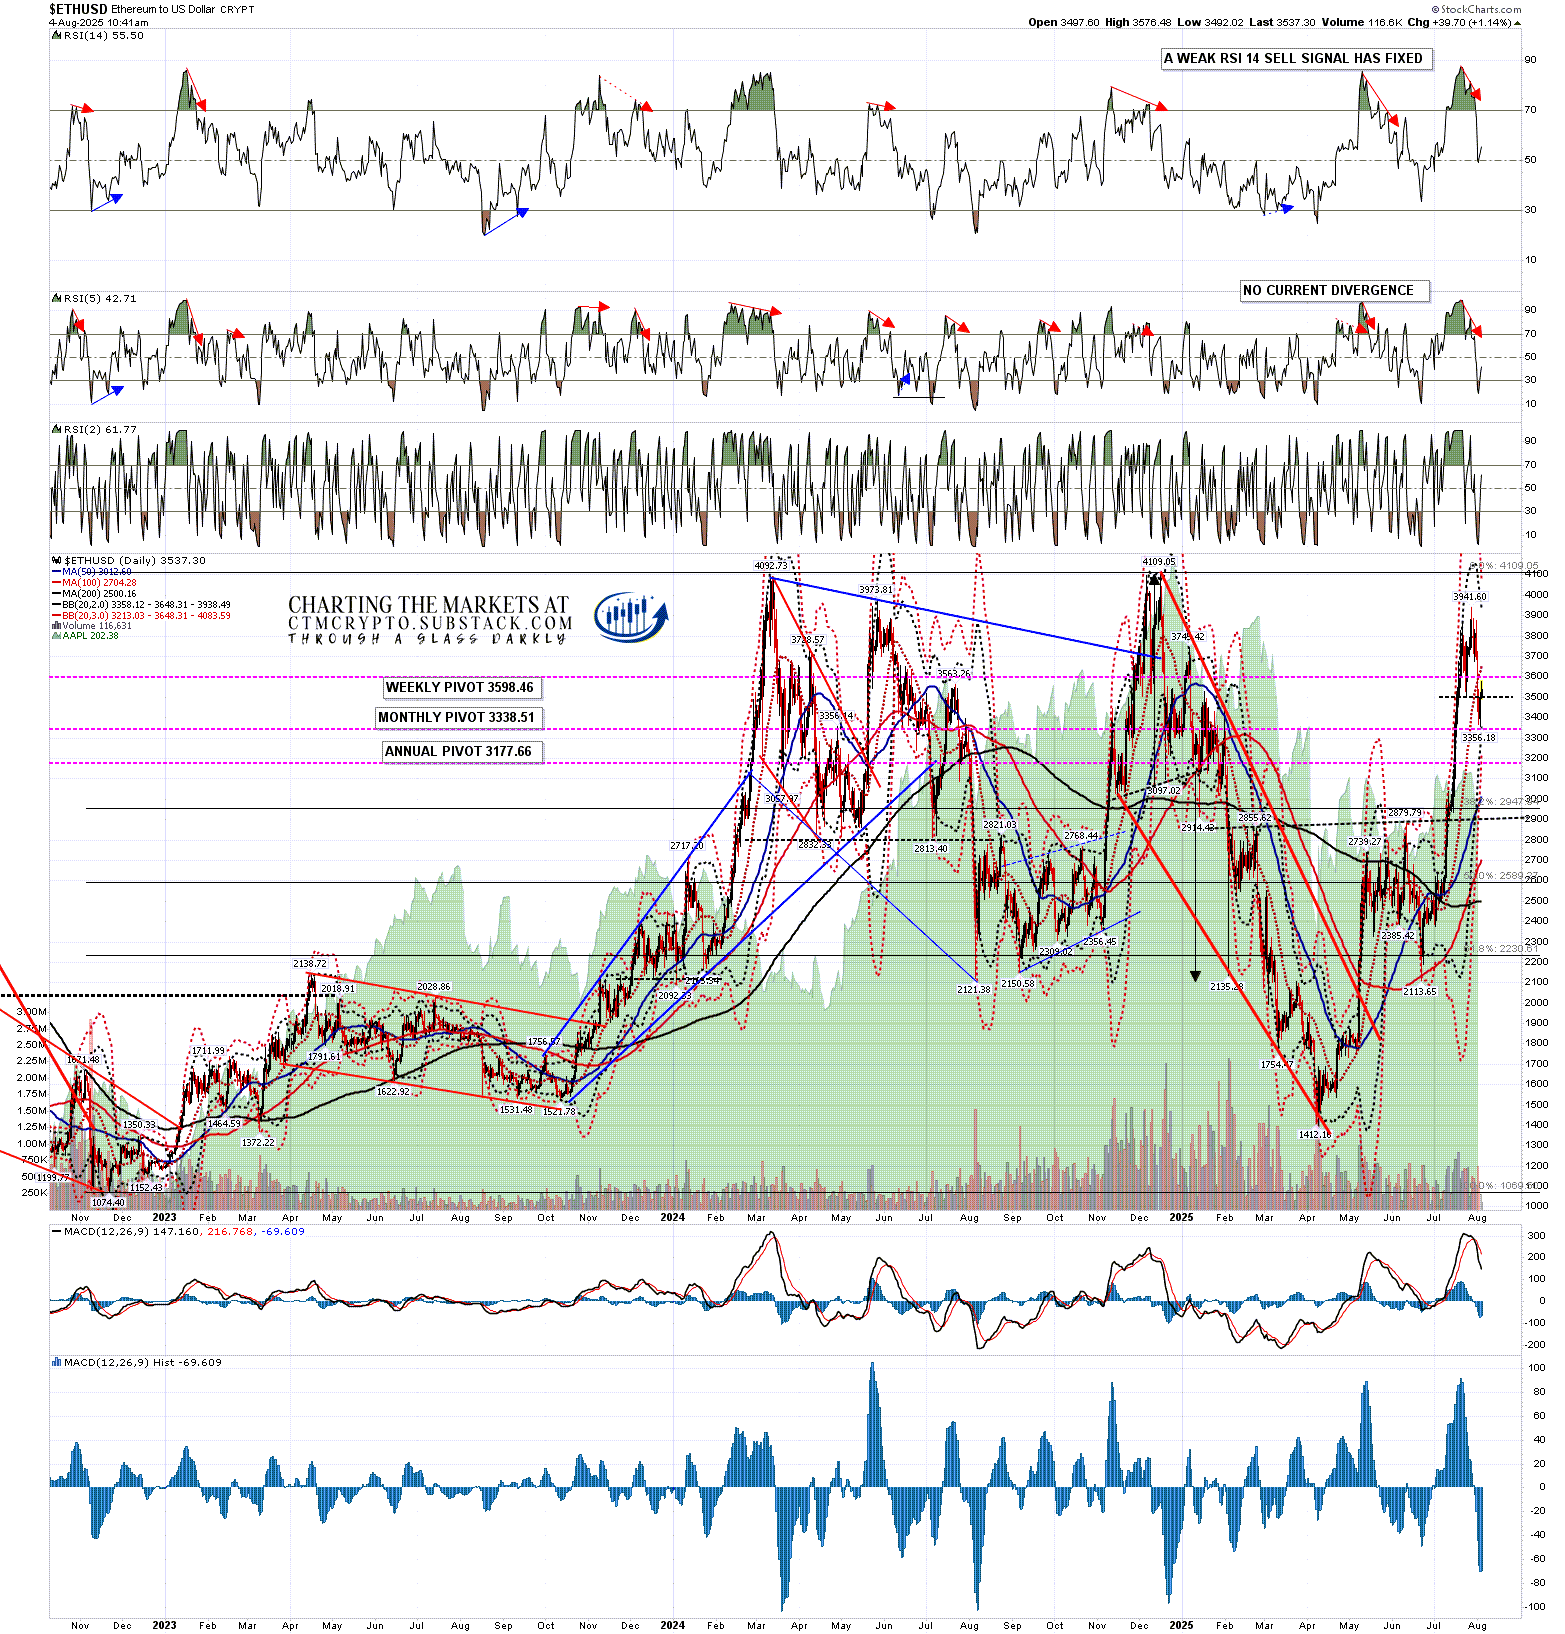
On the Ethereum daily chart there was a high retest, both RSI 14 and RSI 5 daily sell signals fixed and the RSI 5 sell signal has already reached target. The remaining fixed RSI 14 sell signal is suggesting at least some more downside.
ETHUSD daily chart:
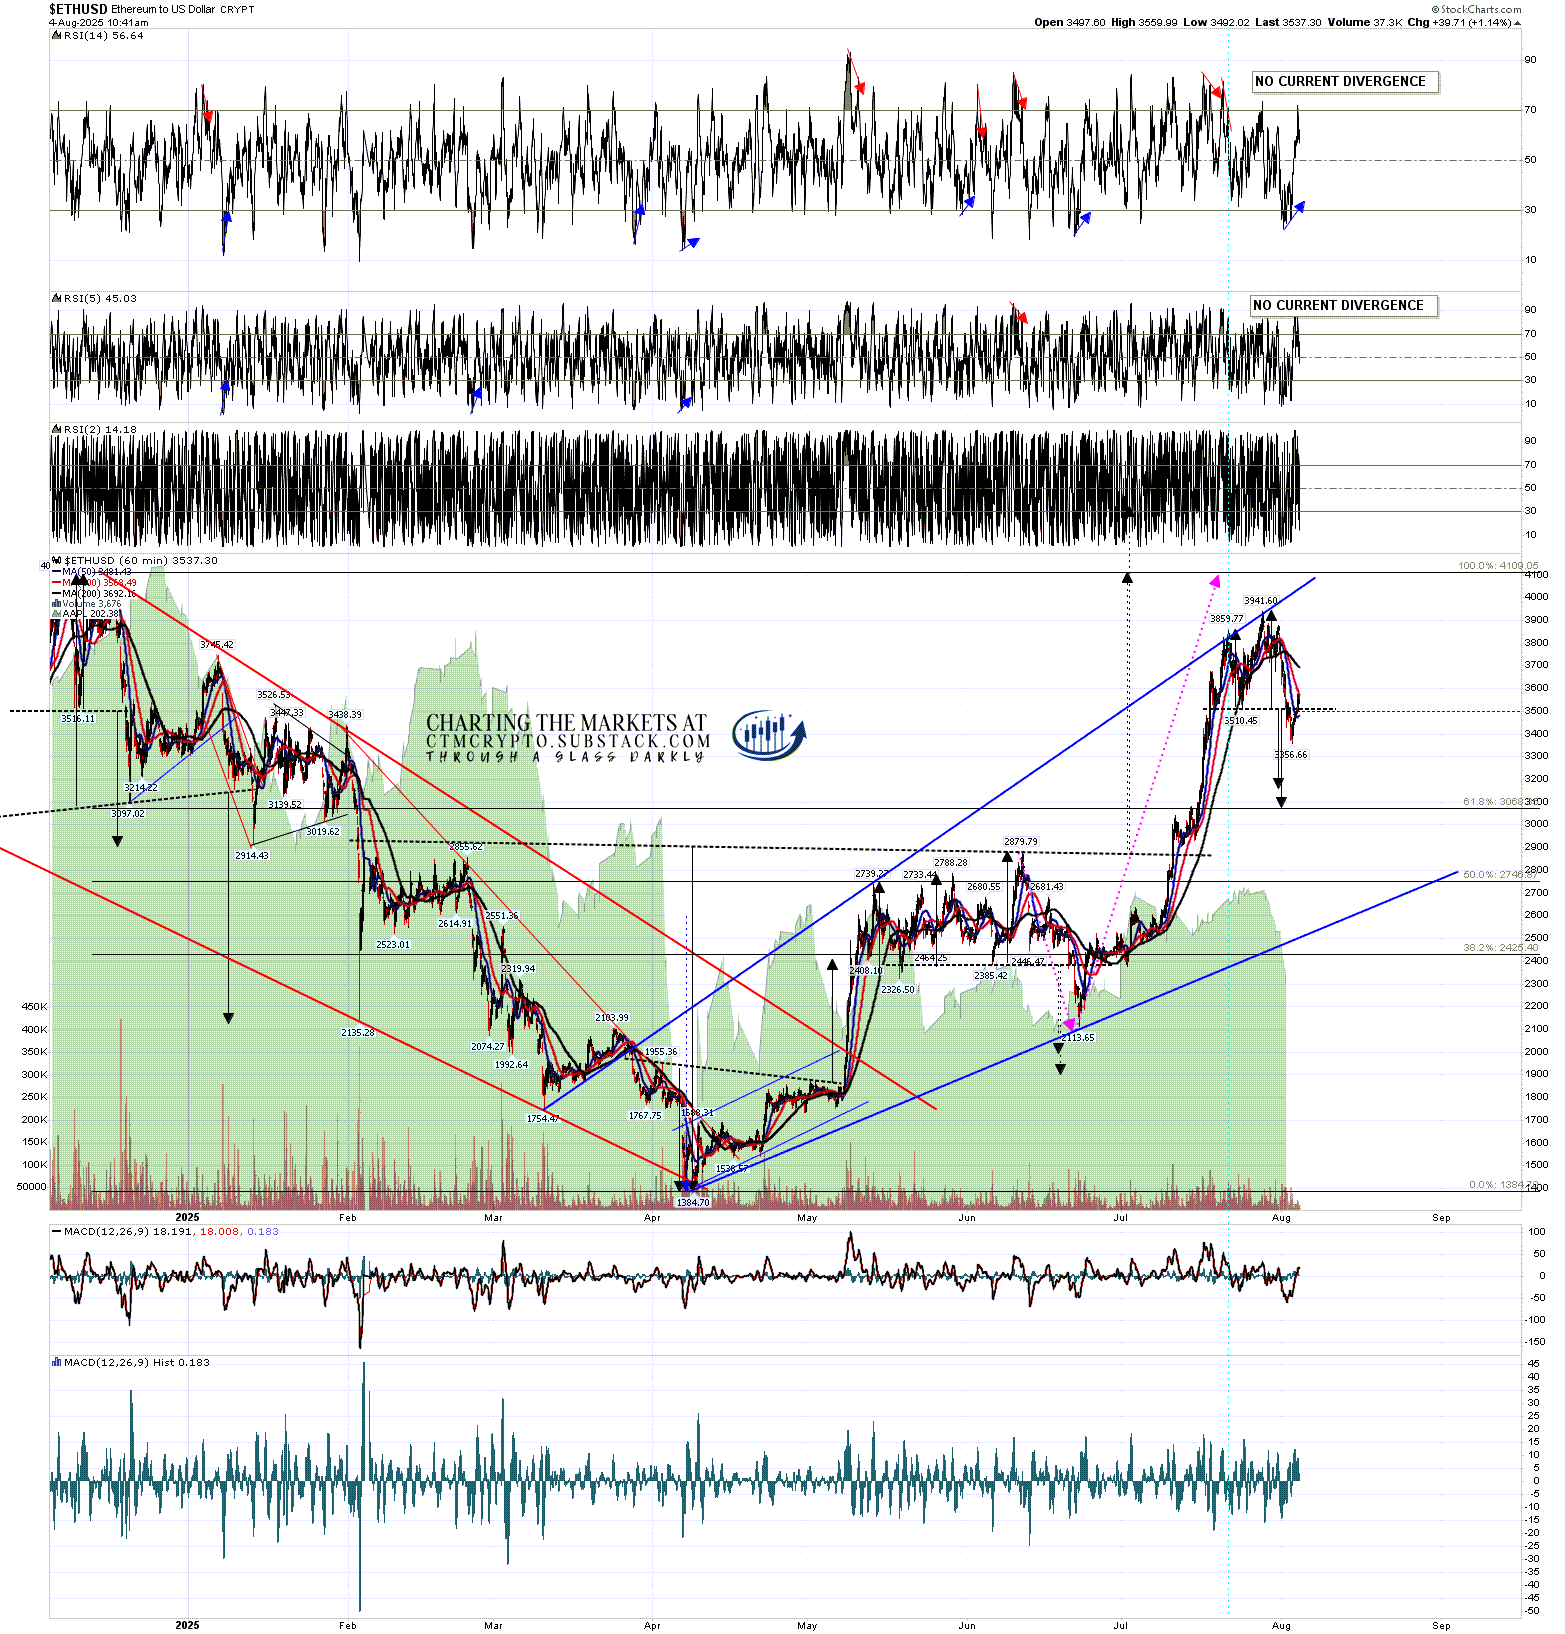
On the Ethereum hourly chart a double top formed and has broken down with a target in the 3080 to 3180 range. Given the overall setup and what is happening on equity indices I like that target. There is a rising support trendline from the April low, currently in the 2550 area. That doesn’t need to be hit in this retracement but if it is hit then I’d prefer that it held.
TEACHING MOMENT:- Why does that rising support trendline not need to be hit? Well An IHS has broken up on Ethereum and in that situation the new pattern that forms from there would often run from the low of the right shoulder rather than the low of the head. That being the case the low of this retracement may be establishing the new support trendline from the right shoulder low.
Ethereum came close to reaching the IHS target and it would be rare to see an IHS fail at this stage. I’m expecting this to be a bullish retracement that then delivers that IHS target at a retest of the December high at 4109.05. I could be wrong of course and, if so, the IHS would be invalidated on a break below the right shoulder low at 2113.65.
ETHUSD 60min chart:
I posted the following note at the end of my post on 13th Jan:
My preferred scenario here is that we see a bullish consolidation either now or soon on Crypto that takes a few months and sets up the next big leg up on Crypto into a possible bull market high in late 2025.
I still like this scenario for a possible overall bull market high on Crypto on or around the end of this year but, as I’ve mentioned before, we have currently seen little evidence that Crypto can sustain a bullish move while equities are in a downtrend. I’m not seeing any strong evidence yet that the current retracement on equity indices is the start of a strong downtrend but, if it should evolve into that, Crypto would likely be dragged down with it.
Since I started doing daily videos on Crypto early last year I’ve got Crypto direction right most of the time and more so than any other analyst anywhere that I’m aware of. I’m a very good analyst and all three of these instruments are very classical chartist friendly. I’m not much of a marketer though, and the free Crypto substack I set up last August still has less than 200 readers. I’d like to increase that readership and invite any suggestions on how I could do that.
I am thinking about setting up a second YouTube Crypto channel and recording videos giving likely market direction without requiring the viewers to have some knowlege of technical analysis to understand the videos. Comments on that and other suggestions very welcome.
If you’d like to see more of these posts and the other Crypto videos and information I post, please subscribe for free to my Crypto substack. I also do a premarket video every day on Crypto at 9.05am EST. If you’d like to see those I post the links every morning on my twitter, and the videos are posted shortly afterwards on my Youtube channel.
