
My speculation yesterday morning that SPX might well retest the ES weekly pivot at 1909 from the ES low for the day at 1865 proved to be right, and the possible H&S that I was speculating about in the morning has now made an ideal right shoulder high. You can see the setup on the 15min chart below. If this pattern completes and breaks down, then we should see the retest of the 1812 low in the next couple of weeks. SPX 15min chart:
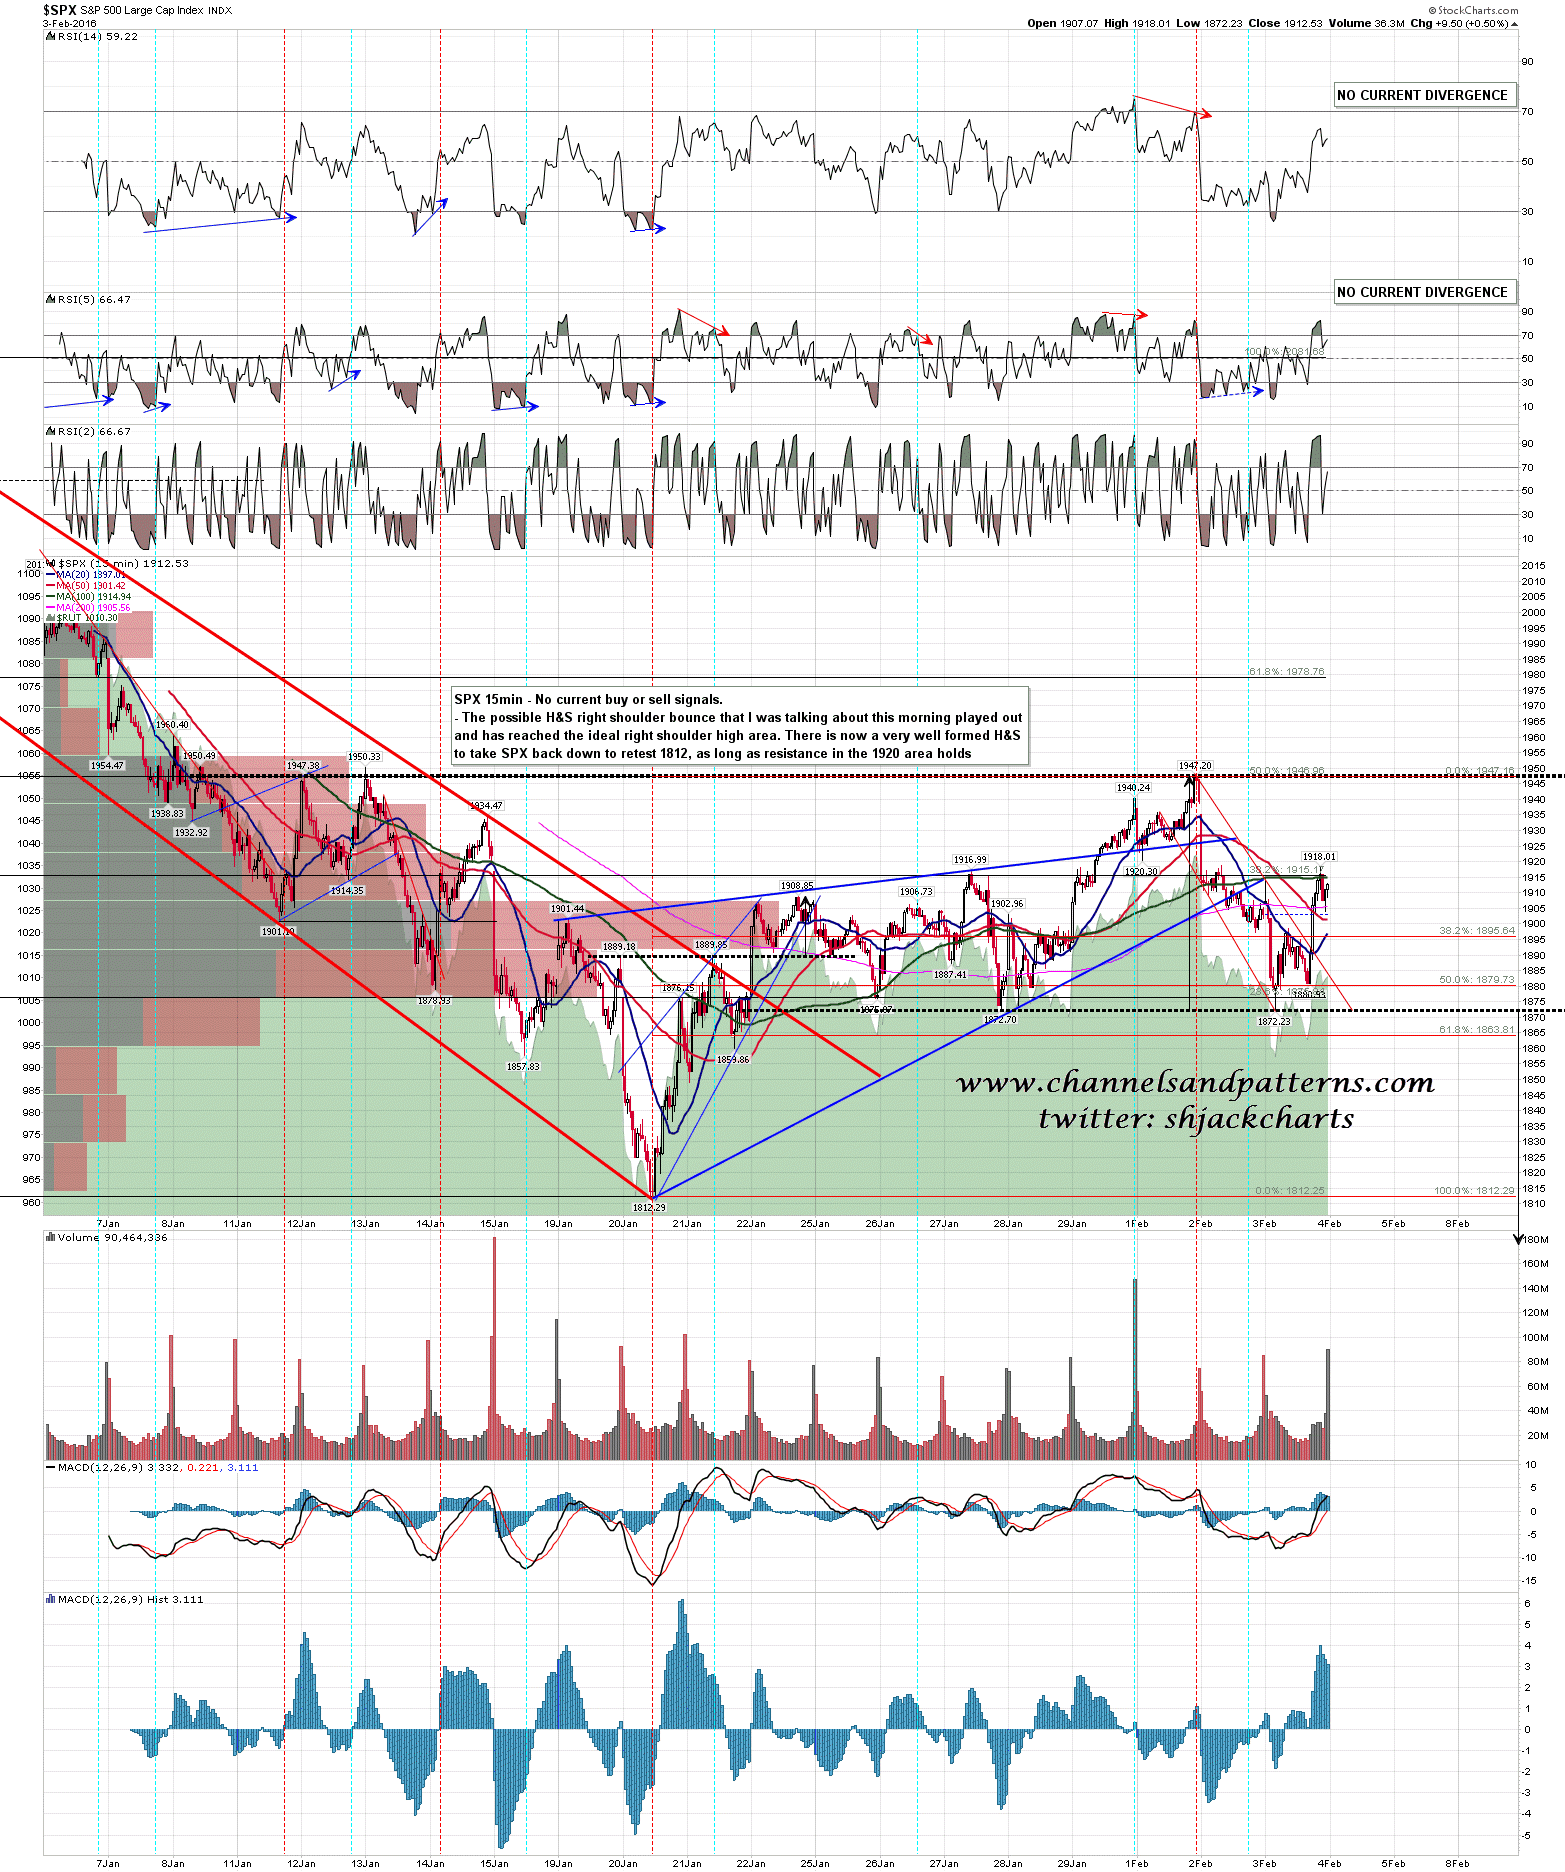
Down is very much the obvious direction here, as the rising wedge that formed from the low is an obvious bear flag on the bigger picture. If the H&S completes and breaks down then the first target is the retest of the 1812 low, and on a sustained break below, the full flag target would be in the 1690 area, though there is strong support in the 1750-60 area at the rising support trendline from the March 2009 low.
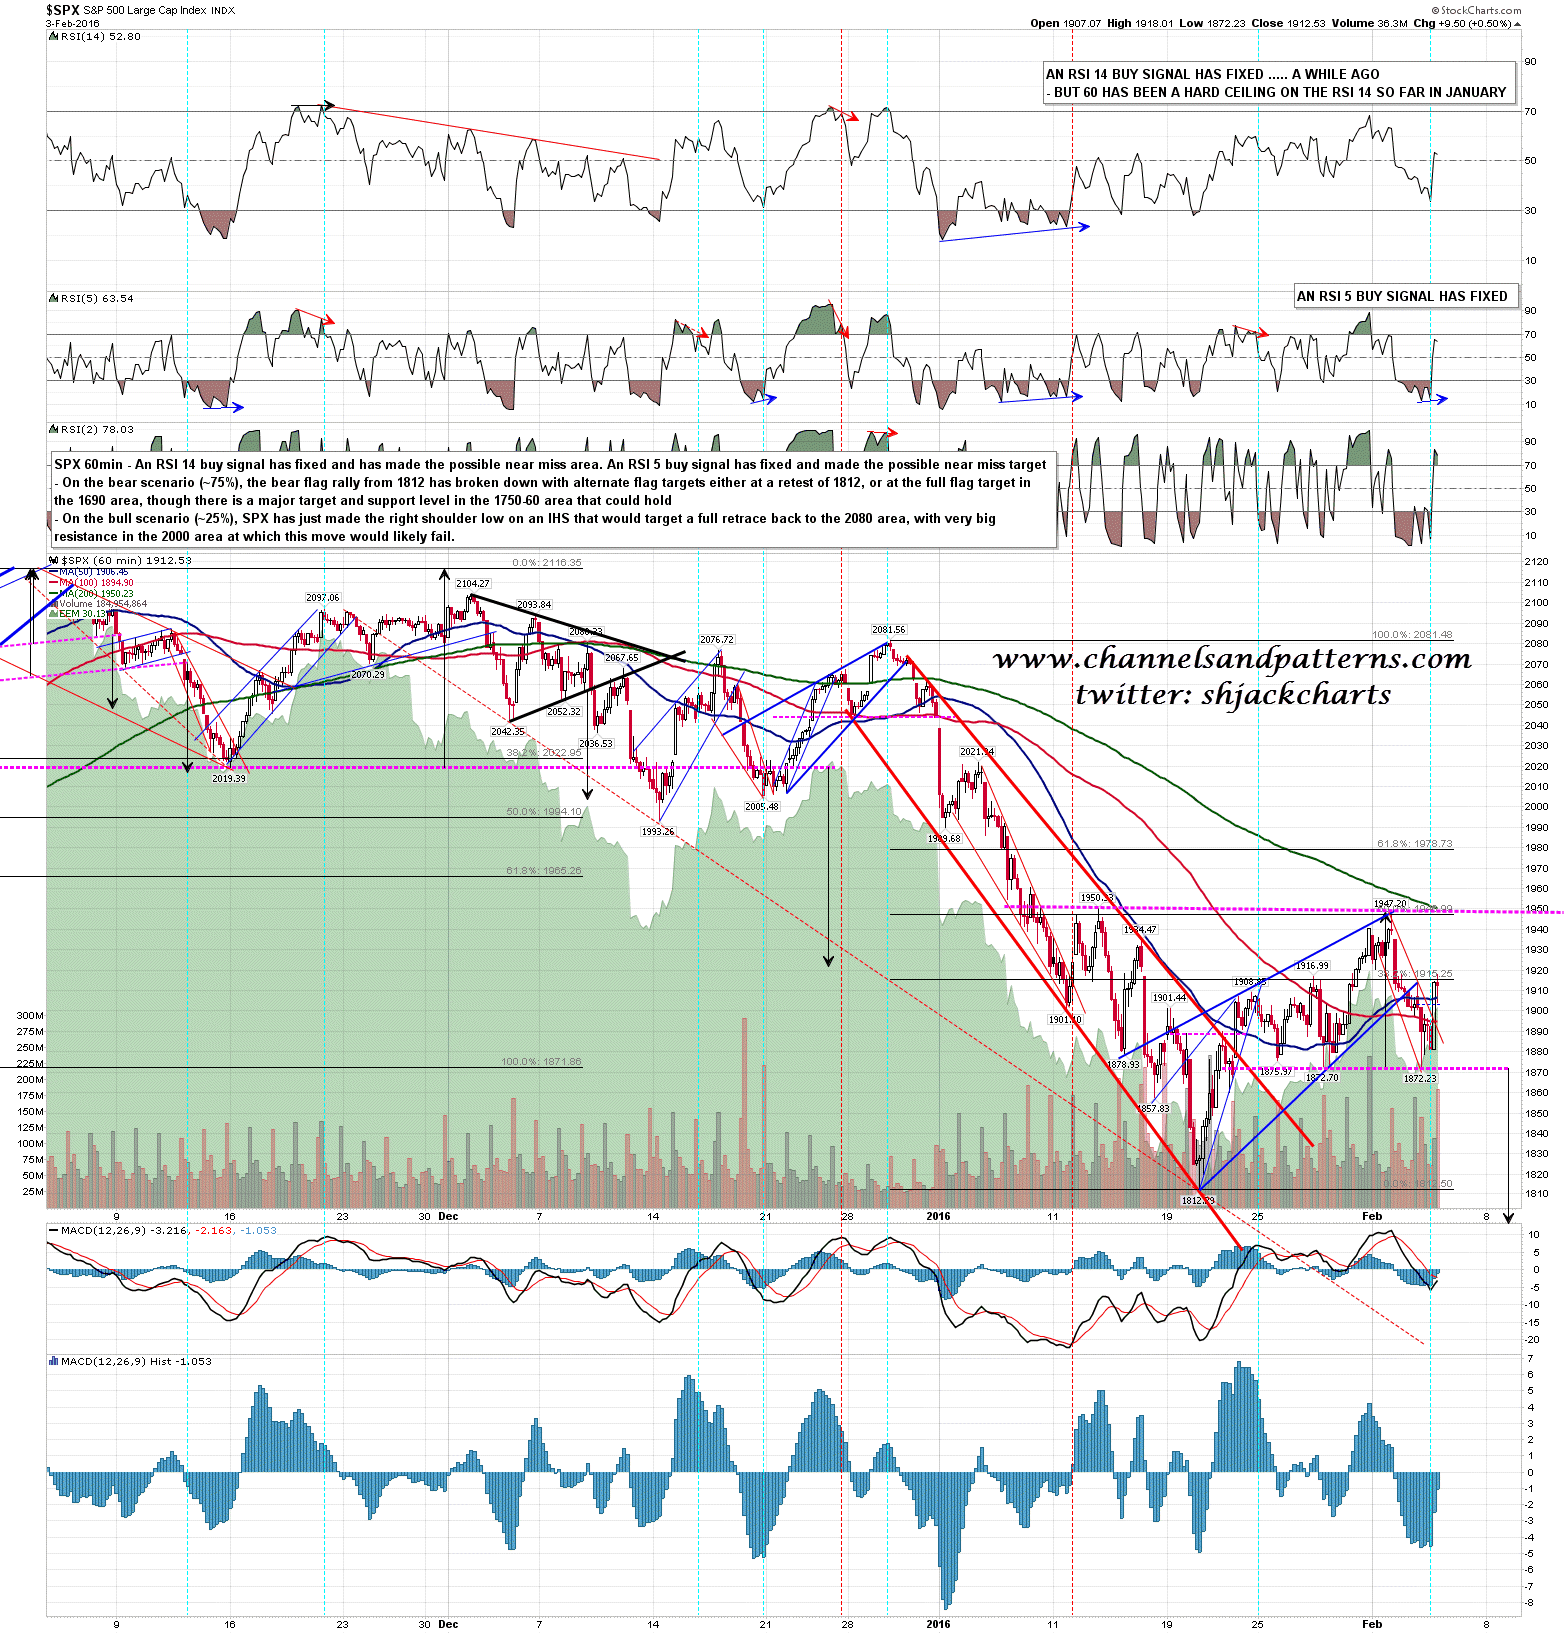
What I would very much note here is that a move to retest 1950 SPX would complete a possible IHS that would target a retest of 2080. That’s really not the obvious option here, but if we should see a break over the current rally high, I would be taking this IHS seriously, though there would still be major resistance in the 2000-20 area. SPX 60min chart:
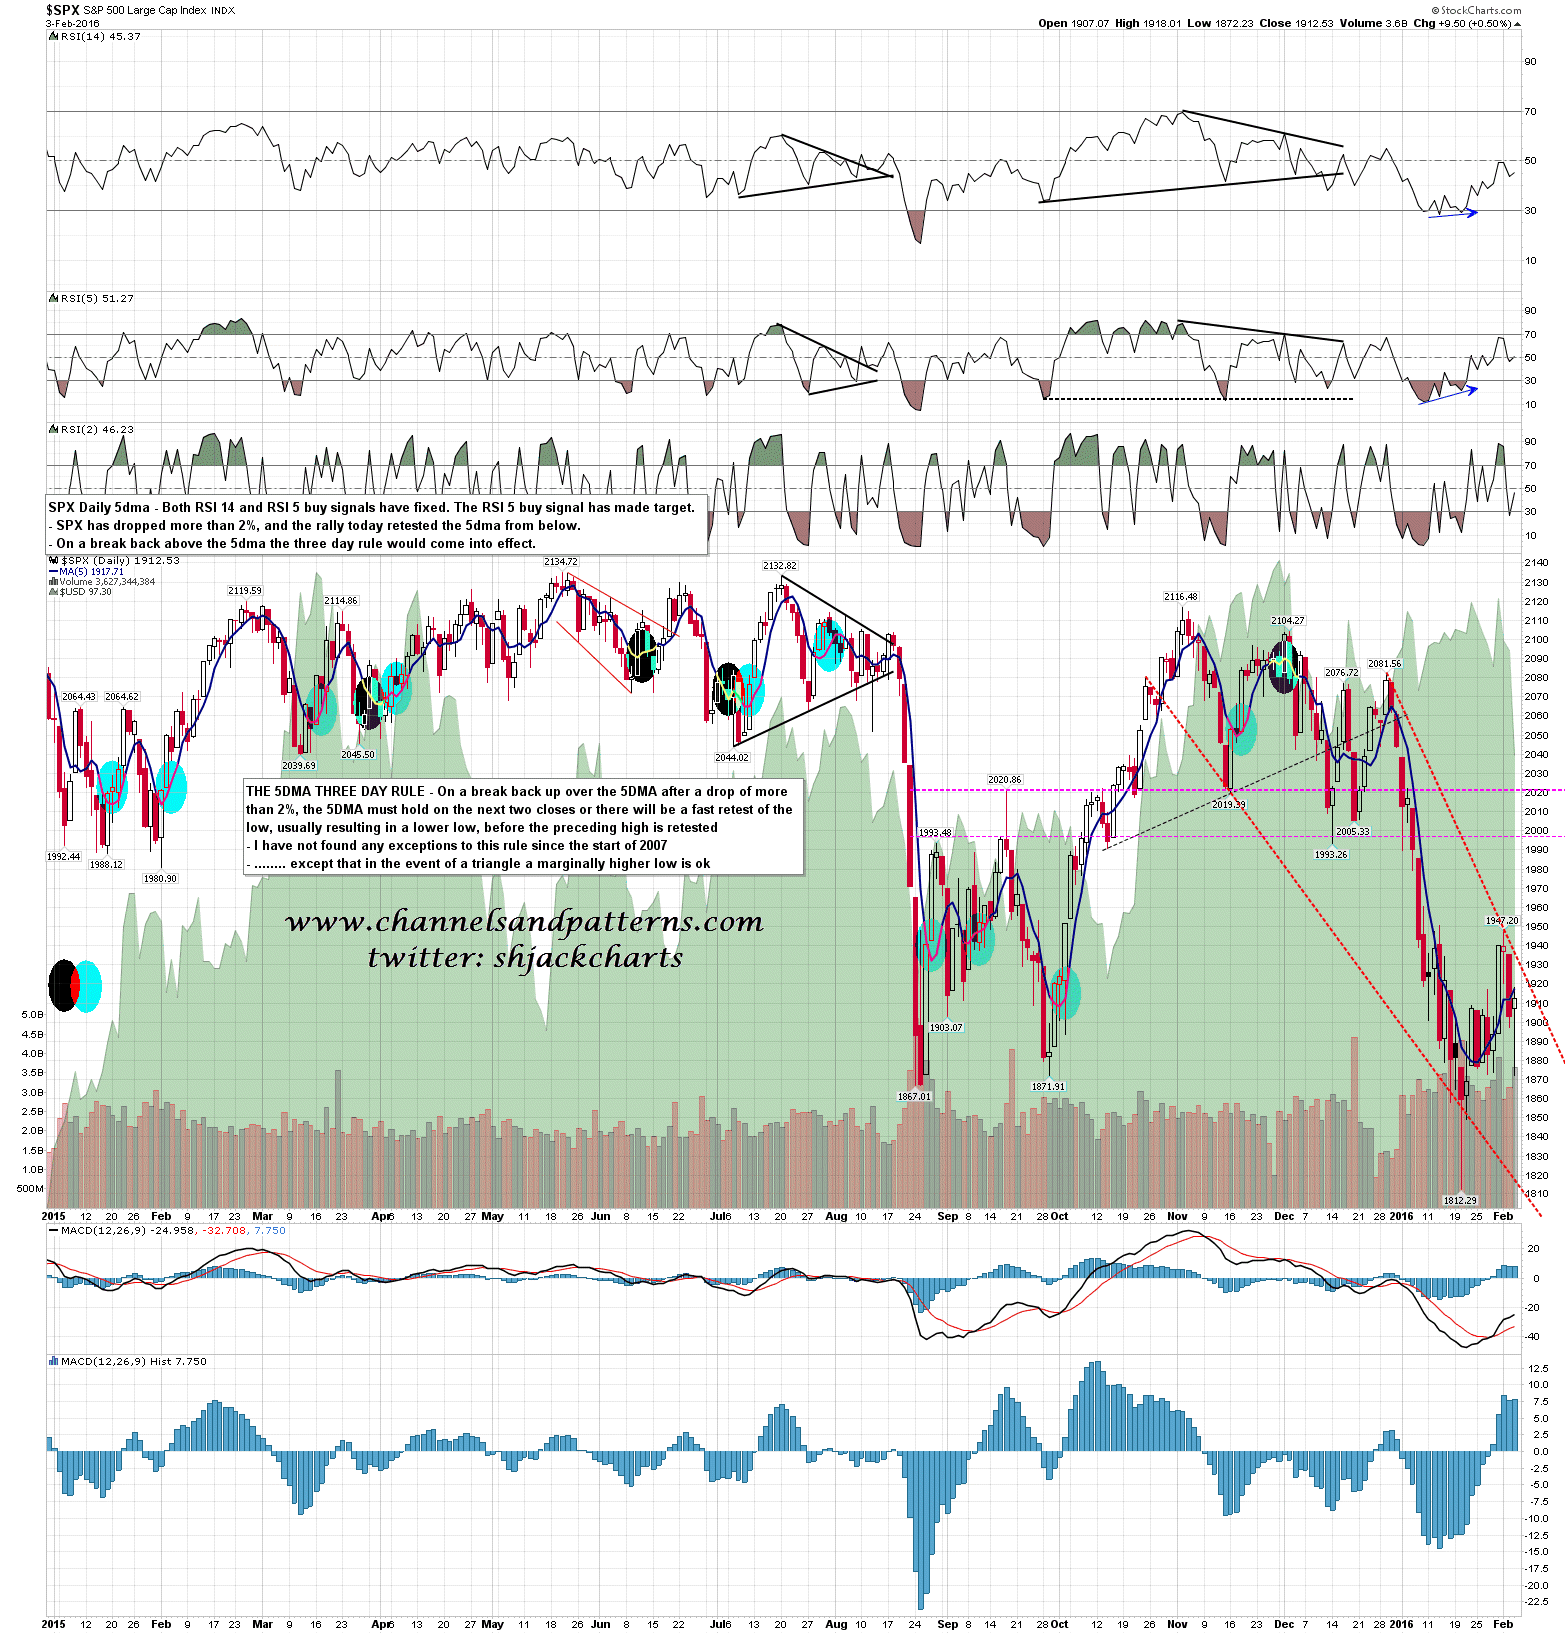
If we should see a break up today then key closing resistance is at the 5dma, currently in the 1917 area, and almost exactly at yesterday’s high. A closing break back over this today would be cautiously bullish. SPX daily 5dma chart:
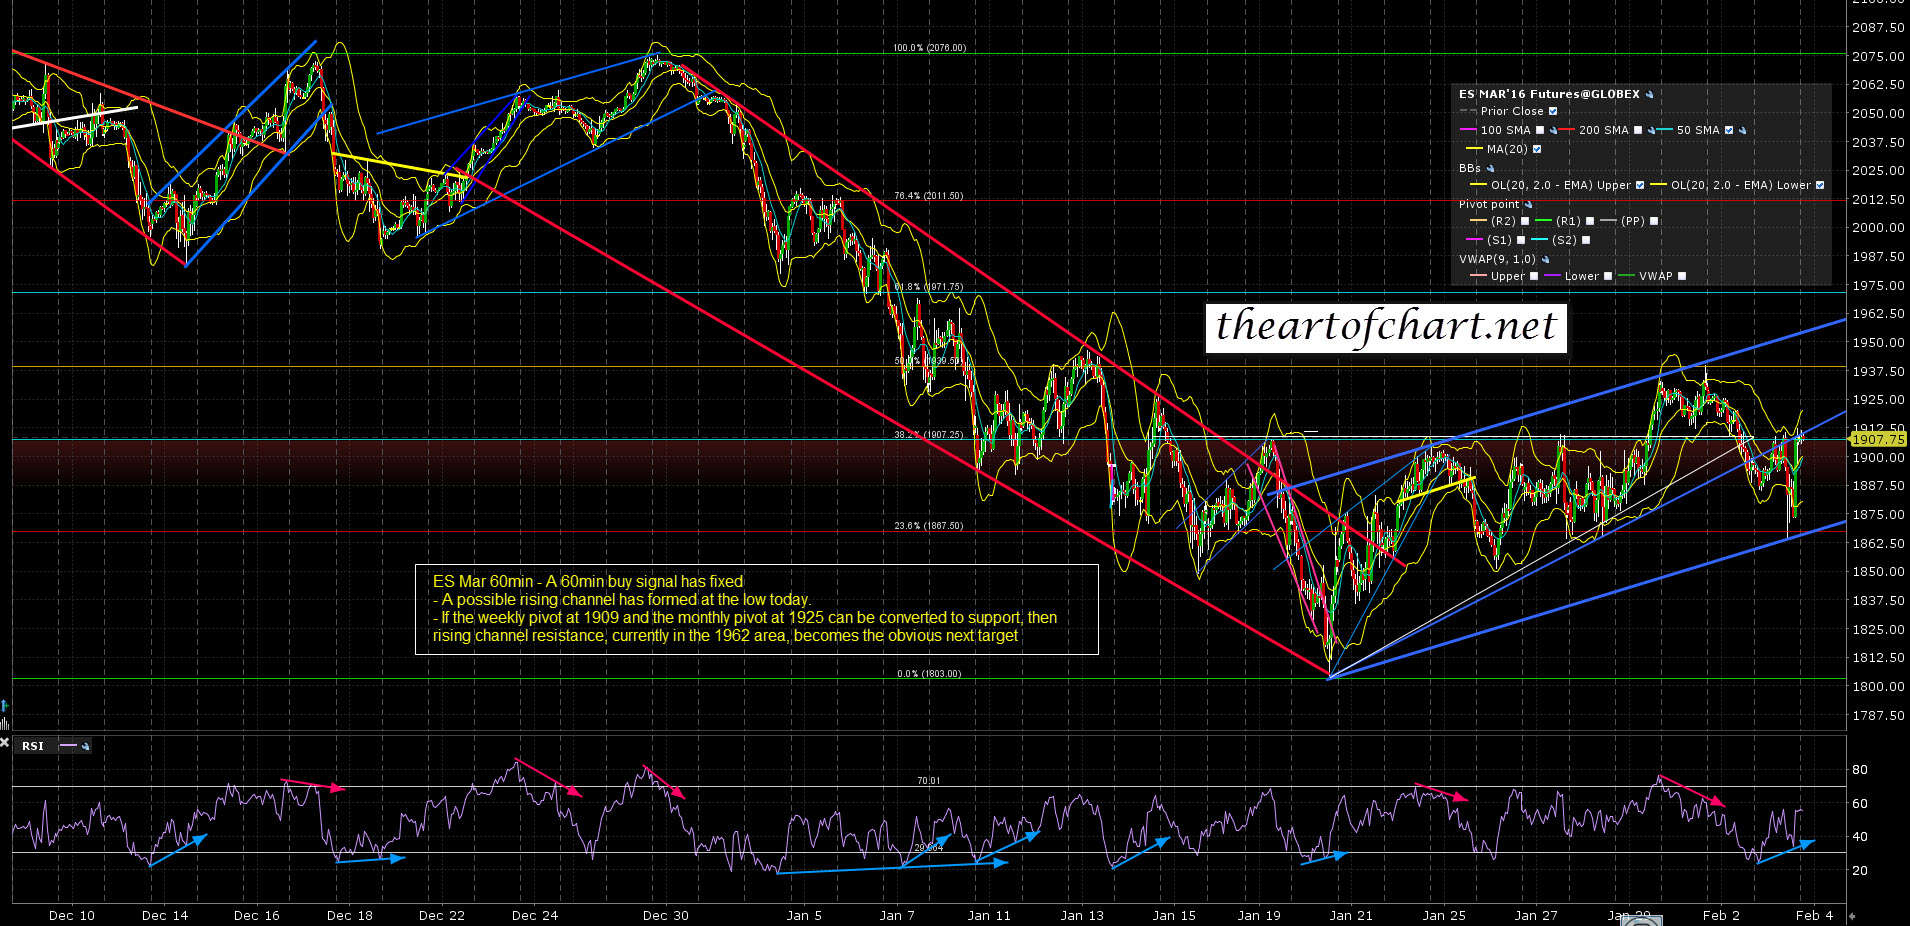
Also potentially bullish here is that ES established a rising channel at the low yesterday, and TF did the same. Until ES breaks this channel then there is obviously potential for the next target to be at channel resistance, currently in the 1960-70 area. The two important resistance levels to watch here are the ES weekly pivot at 1909 (1915 SPX area) and the ES monthly pivot at 1925 (1931 SPX area). If those levels can be broken and converted into support then the bullish scenario here has a serious shot. Until that happens the obvious lean is continuation down. ES Mar 60min chart:
Today is another cycle trend day, so there are 70% odds of the day being dominated by buyers or sellers. The ES action overnight isn’t encouraging for bulls so far, and it this is going to resolve down today then I’ll be looking for an AM high that fails.
