
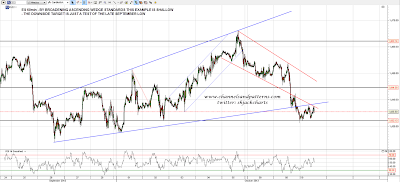
I posted a possible broadening ascending wedge just after the high on ES last Friday, and ES reached support trendline yesterday, bounced there and then broke down. The target is a test of the late September low at 1424. The odds of making the target are only 57% but given that this wedge incline is so shallow I'd be inclined to put the odds here rather higher. Overnight the action looks like a bear flag:
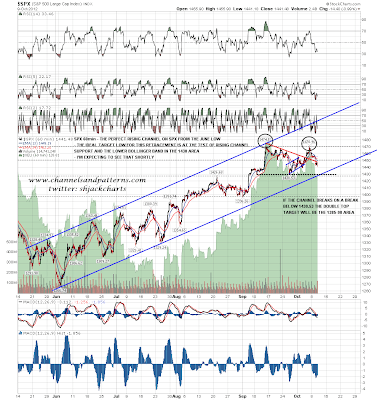
That target is backed up on the SPX daily chart by the confident break below the middle bollinger band yesterday. as there are no important DMA targets between the bands at the moment the target is a test of the lower bollinger band in the 1433 area:

That brings us back to the rising channel on SPX. The lower trendline of that channel has been my primary target since we saw the post QEX announcement reversal at the top of this channel. Channel support is in the 1430 area today, with the late September low at 1430.53. That is double-support and on a break below that, as I mentioned yesterday, I would have a double-top target in the 1385-90 area. A breakdown is more likely than it was due to the breakdown on AAPL on Monday:
On TRAN the support area around 5003 is being retested. On a break below with any confidence I would write off the W bottom target in the 5130 area and we might well then see the lows retested:

EURUSD broke the rising support trendline from mid-August yesterday and the obvious downside target is now rising support from the 2012 low in the 1.277 area. declining resistance is in the 1.293 area:

CL broke up yesterday and made it most of the way to my 93.4 target. That is a strong resistance area and also a possible W bottom or IHS neckline. I'll be watching that area for possible reversal but on a break above with confidence I'd be wondering seriously about a return to the 100 area to test the highs. Obviously this looks jarringly bullish today:

Obviously everything on ES and SPX is lined up for a test of the late September lows in the next day or two, and I'm expecting to see that test. Will the rising channel on SPX hold? I was assuming it would, and I would be sorry to see such a helpful guide lost, but the breakdown on AAPL has me wondering whether it will hold. Until we see a break below that is very strong support and if we do see a break the daily BB setup suggests a retest soon afterwards. We shall see.
I'll be posting AAPL charts on twitter after the open looking at the ongoing setup there as that is obviously very important here. What I will say now about AAPL is that H&S patterns where there is a gap below the neckline to break it generally make target in my experience, and the target on AAPL is in the 590 area. There are no guarantees in life however.
