Here’s how things stand as at 10:30 am EST.
The YM, ES, NQ & TF are contending with an opening gap down. The NQ & TF are leading in the weakness as they are back in their old (lower) trading ranges.

Slope initially began as a blog, so this is where most of the website’s content resides. Here we have tens of thousands of posts dating back over a decade. These are listed in reverse chronological order. Click on any category icon below to see posts tagged with that particular subject, or click on a word in the category cloud on the right side of the screen for more specific choices.
Here’s how things stand as at 10:30 am EST.
The YM, ES, NQ & TF are contending with an opening gap down. The NQ & TF are leading in the weakness as they are back in their old (lower) trading ranges.
Japan’s pro-active vs. Europe’s re-active monetary actions produced different market reactions today, as shown below. I wonder which one will work out in the long run?
By the way, I’m wondering if Mario Draghi considers whether the ECB’s actions, in dealing with the Cyprus bailout situation, are, in fact, in line with their ‘accommodative’ moneary policy, which was mentioned in today’s press release — “Against this overall background our monetary policy stance will remain accommodative for as long as needed.” Since he used the words “remain accommodative,” I have no alternative but to assume that he considers that all ECB actions, to date, fall into that category…and that the same ‘accommodative monetary policy’ would be used in other situations with other countries.
Forewarned is forearmed!


Source: http://www.indexq.org/
(Note from Tim: my “free month” of Slope+ is a big hit, but I wanted to move on to a real post; be sure to check out my special offer if you haven’t already; anyway, let me turn the microphone over to Strawberry Blonde…….”)
As of today (Wednesday) at 12:30 pm EST, the TF has broken through and is now trading below this year’s strong uptrending channel, as shown on the 4-Hour chartgrid below of the YM, ES, NQ & TF.
We now see a series of lower lows and highs on the TF, but not yet on the others. Any retest of and failure at the bottom of the channel by the TF will likely produce a drag (and possible pullback/correction) on the other three.
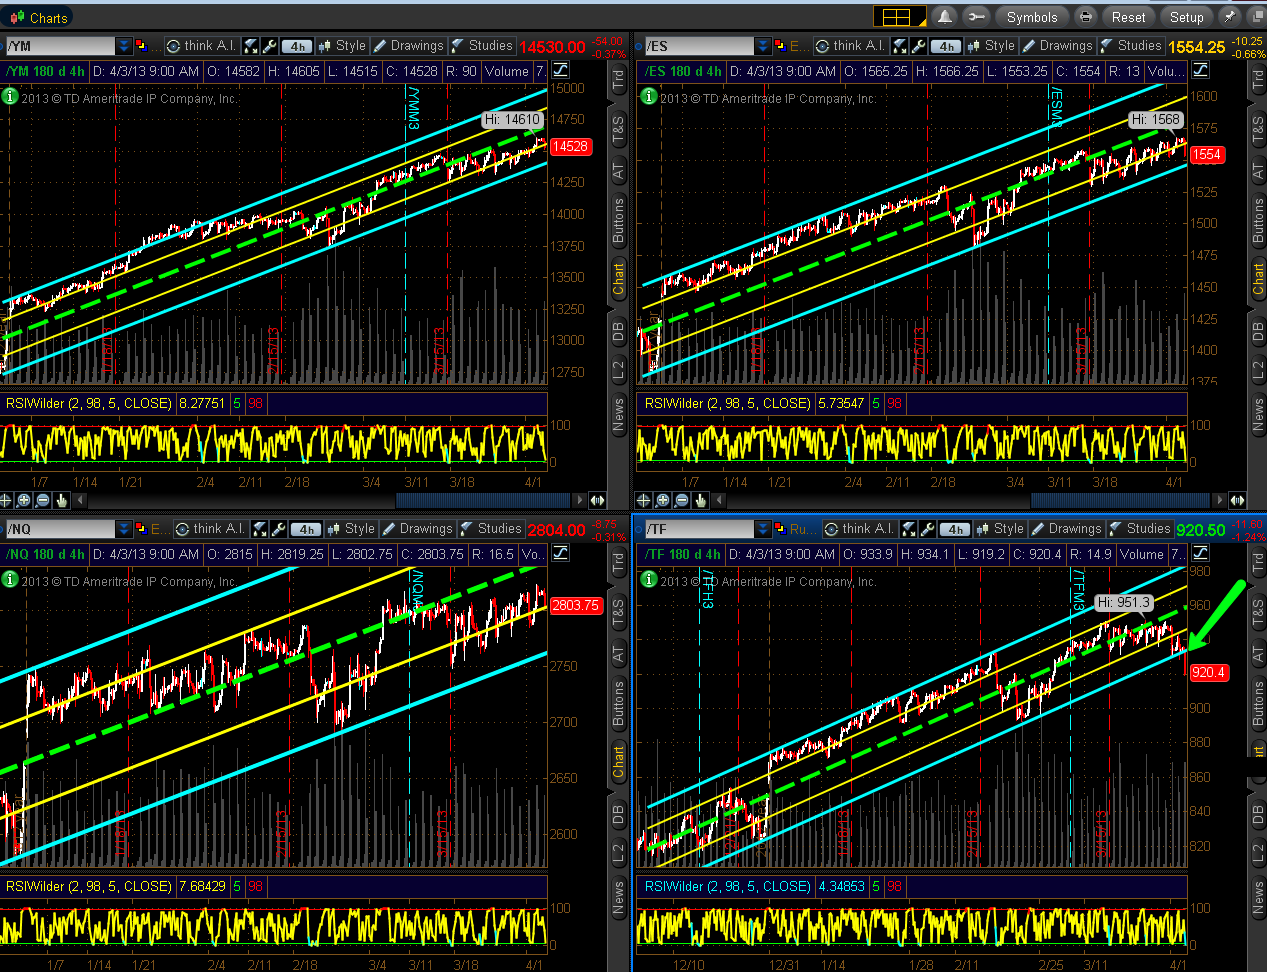
UPDATE 2:00 pm EST — The last swing low of 1552.50 (and uptrend) has now been broken on the ES 4 Hr. as it is approaching the bottom of its channel at 1546ish.
Like the zigzag roads that the Romans built in order to ascend mountains, the market continues to wind its way upwards, as demonstrated on this 60 min (market hours only) chart of the Russell 2000 E-mini Futures Index (TF).
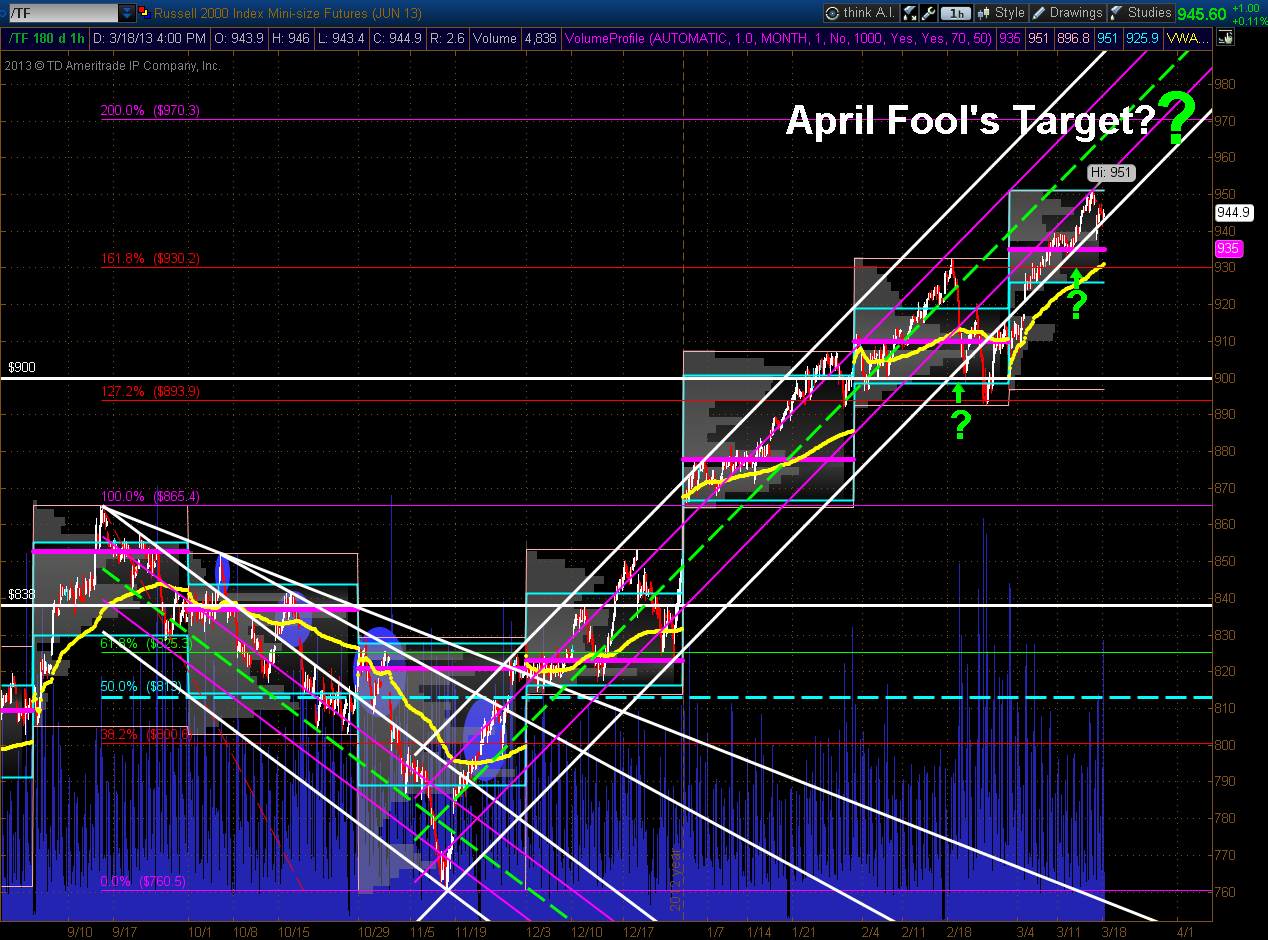
At the moment (Monday's close), price has been generally confined to the uptrending channel. Until we see that trend broken by a series of lower highs and lows (with deeper drops), we'll likely see that continued, as the markets (backed by the Fed's unprecedented monetary easing and asset purchase programs) seem to be adept at fending off negative global and domestic news and economic events, including perceived threats of negative contagion. In other words, the markets appear to have the mentality of "Id imperfectum manet dum confectum erit." — "It ain't over until it's over."
However, the notion that "government 'theft' of bank depositors' savings could not spread to other countries and would not be a concern anyway, because money tied up in the markets is not sitting in a deposit account and is, therefore, safe from a similar fate" would be naive or ill-conceived. The mere fact that this has been conceived for one country is evidence that such a scenario exists for others as an unformed probability and is subject to the irrefutable laws of nature. The Law of Attraction dictates that belief in and acceptance of such a possibility will be attracted to that source. Ultimately, force never ends well and what happens in life is eventually reflected in the markets.
After dropping overnight (presumably in response to the bailout conditions of Cyprus), Copper is still trading down near its low of the day. As shown on the Weekly chart below, it has broken below a fairly major uptrend line and both of its 50 and 200 moving averages, is sitting at its Volume Profile POC and lower Bollinger Band, and is just above its lower 1/4 of a longer-term very wide sideways channel.
A drop and hold below today's lows could send price down to 3.20 or lower to 3.00.

