Slope of Hope Blog Posts

Slope initially began as a blog, so this is where most of the website’s content resides. Here we have tens of thousands of posts dating back over a decade. These are listed in reverse chronological order. Click on any category icon below to see posts tagged with that particular subject, or click on a word in the category cloud on the right side of the screen for more specific choices.

Money Flow for March Week Two (by Strawberry Blonde)

By -

Further to my last Weekly Market Update, this week's update will look at:


  • 6 Major Indices
  • 9 Major Sectors


6 Major Indices


As shown on the Weekly charts and the percentage gained/lost graph below of the Major Indices, the largest gains were made this past week by the Dow Transports, followed by the Dow Utilities, the Russell 2000, the Dow 30, and the S&P 500. Only the Nasdaq 100 ended with a minor loss.


(more…)

Sparse Foreign Interest in U.S. Securities (by Strawberry Blonde)

By -

Foreign interest in U.S. securities has been sparse and sporadic since mid-2011, as shown on the graph below. Data released today shows another monthly drop in foreign purchase of U.S. securities.


Inasmuch as "demand for domestic securities and currency demand are directly linked because foreigners must buy the domestic currency to purchase the nation's securities," one has to wonder how much longer the U.S. economy can continue to "recover" and at what pace without increased foreign interest…particularly as the SPX faces this potential scenario.


(more…)

Golden Fibonacci Ratio on EUR/USD (by Strawberry Blonde)

By -

I last wrote about the EUR/USD Forex pair on February 7th. At that time, price was trading around 1.3400.

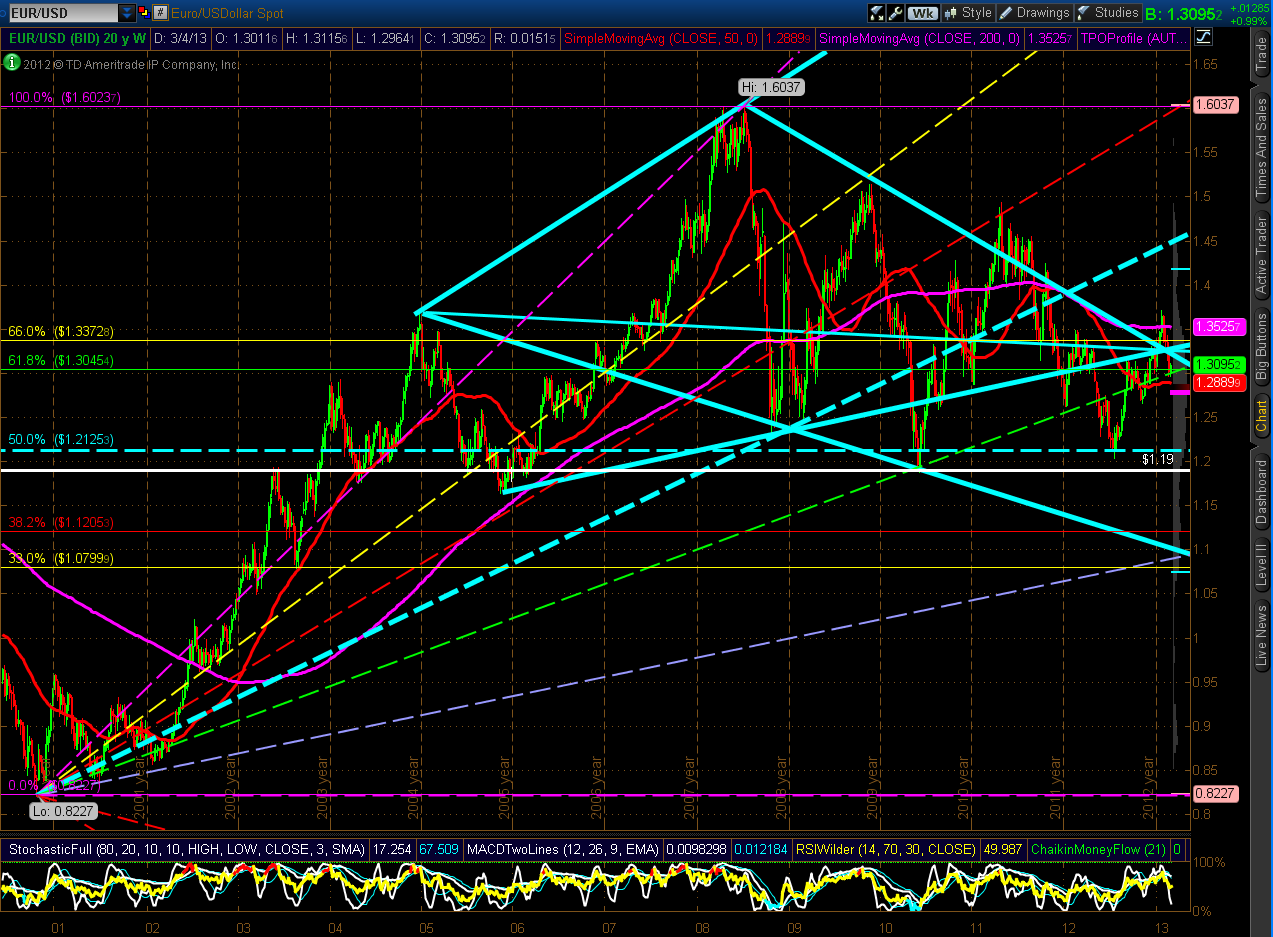
Since then, price fell and has bounced somewhat…it's now 1.3095 (as of 11:29 am EST on Thursday) and is trading just above a confluence of two Golden Fibonacci Ratios (61.8%), which is near-term support at 1.3045, as shown on the Weekly chart below.

Price is trading in between the 50 sma (red) and 200 sma (pink). These moving averages are in a bearish "Death Cross" formation, and, as such, price is still under its bearish influence. A hold above 1.3045 could send it back up to retest its last swing high…a hold above that level could, finally, propel the EUR/USD higher to, eventually, reverse the moving averages to form a bullish "Golden Cross." This could take some time to play out, however, and we may see further range movement around both moving averages until then….otherwise, a drop and hold below the 50 sma could send price back down to retest the 50% Fibonacci retracement level at 1.2125, or lower.


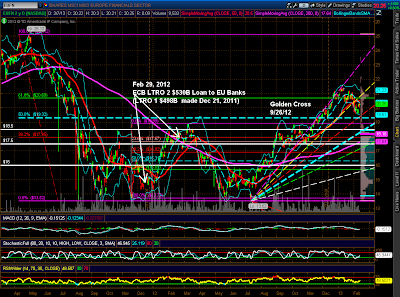
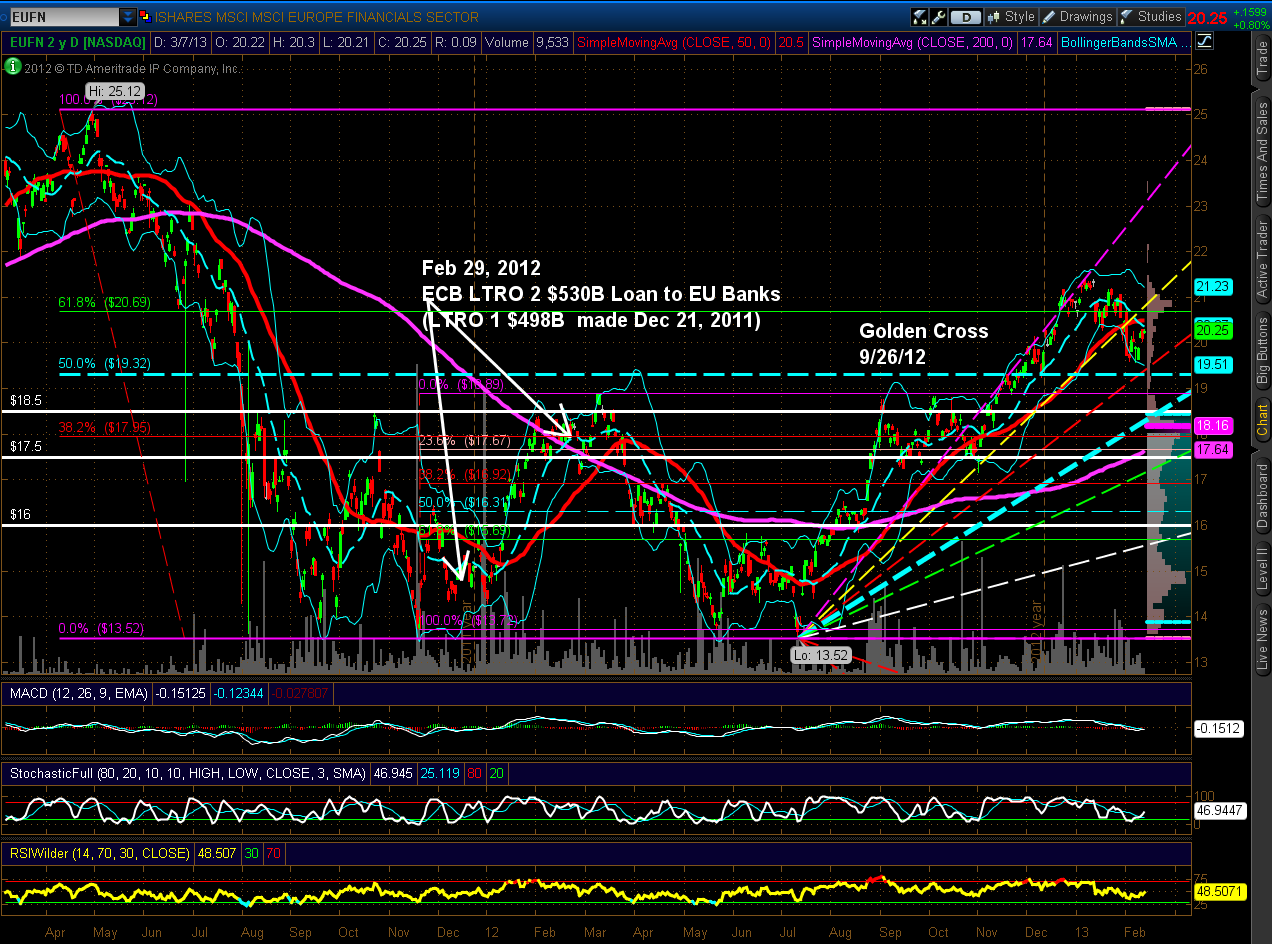
In addition, and as a confirmation to any move on the EUR/USD, I'll be watching the European Financials ETF (EUFN). At the moment, it's in overall uptrend from its July 2012 lows, but has experienced a pullback from its February highs of this year, as shown on the Daily chart below. The Stochastics and RSI indicators have turned up and the MACD looks ready to cross to the upside, as well. A price break and hold above its 61.8% Fibonacci retracement level and 50 sma at 20.69 should produce that MACD crossover to, potentially, propel price higher. Otherwise, a drop below Fibonacci confluence at 19.32 could send price down to its 200 sma at 17.60/50ish, or lower.


Commodities Set to Join the Party? (by Strawberry Blonde)

By -

I wrote about the Commodities Sector ratio of DBC:SPX here on January 20thDBC had been underperforming the SPX, essentially, since mid-2011 and was in a large triangle formation on the Weekly timeframe.

Since then, it has weakened further to make a lower low and has broken below triangle support, as shown below on the Weekly ratio chart of DBC:SPX. There is a slight positive divergence on the Momentum indicator, but it has not hooked up yet.


(more…)