Slope of Hope Blog Posts

Slope initially began as a blog, so this is where most of the website’s content resides. Here we have tens of thousands of posts dating back over a decade. These are listed in reverse chronological order. Click on any category icon below to see posts tagged with that particular subject, or click on a word in the category cloud on the right side of the screen for more specific choices.

Waiting for the Fat Lady to Sing

By -

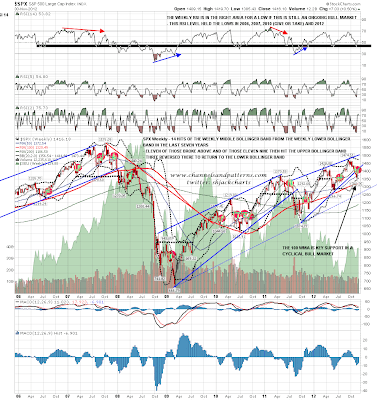
The rally from the Nov 2012 lows appears to be in wave 5, or i suspect it will be a 5 wave advance.

In Elliott Wave terms we call that an impulse wave, it looks virtually text book, although as its pushing higher, it still don’t look completed, I am currently working 2 ideas.
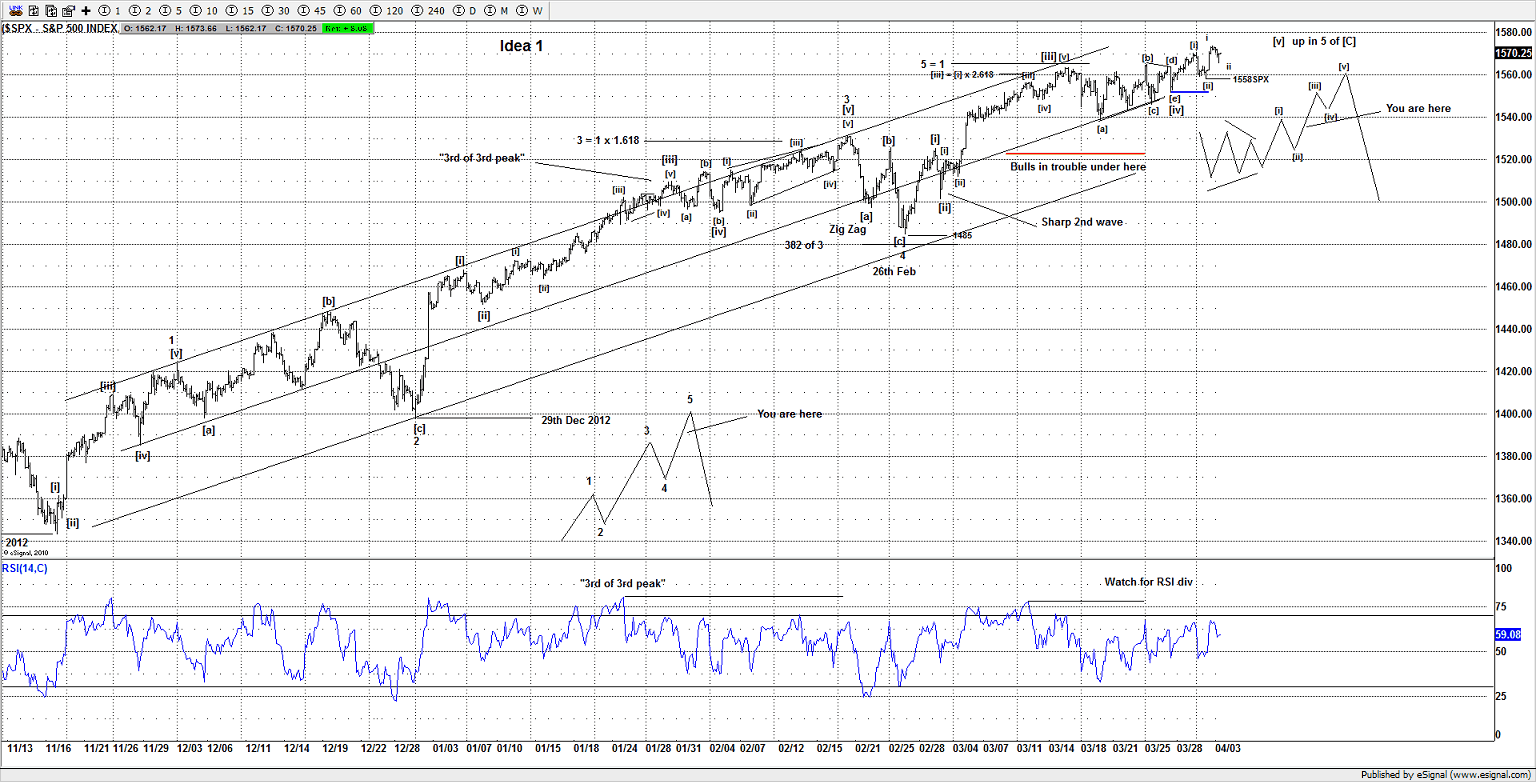
Idea 1

The market is about to push higher in a small 3rd wave of what we call a triangle “thrust”, so today should see more upside above 1581SPX, so some sort of “burst” to confirm this idea and negate Idea 2.

Holding above 1558SPX keeps the market bid, so no matter which idea, it is still bullish above that area, and short term aggressive traders can look to buy dips and use 1558SPX as the risk control point.

A potential target for the end of wave 5 is around the 1590-1600SPX, but its subject to wave structure and counting a 5 wave advance from the wave [e] point of the triangle (blue line).

Idea 2

This is the preferred idea and a potential ending diagonal (non Elliotticians call them bearish wedges).

Although this is limited to 1581SPX as above that area wave [v] would be longer than wave [iii] and that’s a rule violation for the pattern, so its actually quite simple, if a move above 1581SPX, it suggests Idea 1 and the triangle “thrust” option is working, failure to break above 1581SPX suggests the ending diagonal option.

Currently the market has not tipped its hand, but by the end of today’s close i am expecting to have some sort of edge to which idea is working.

ye6042

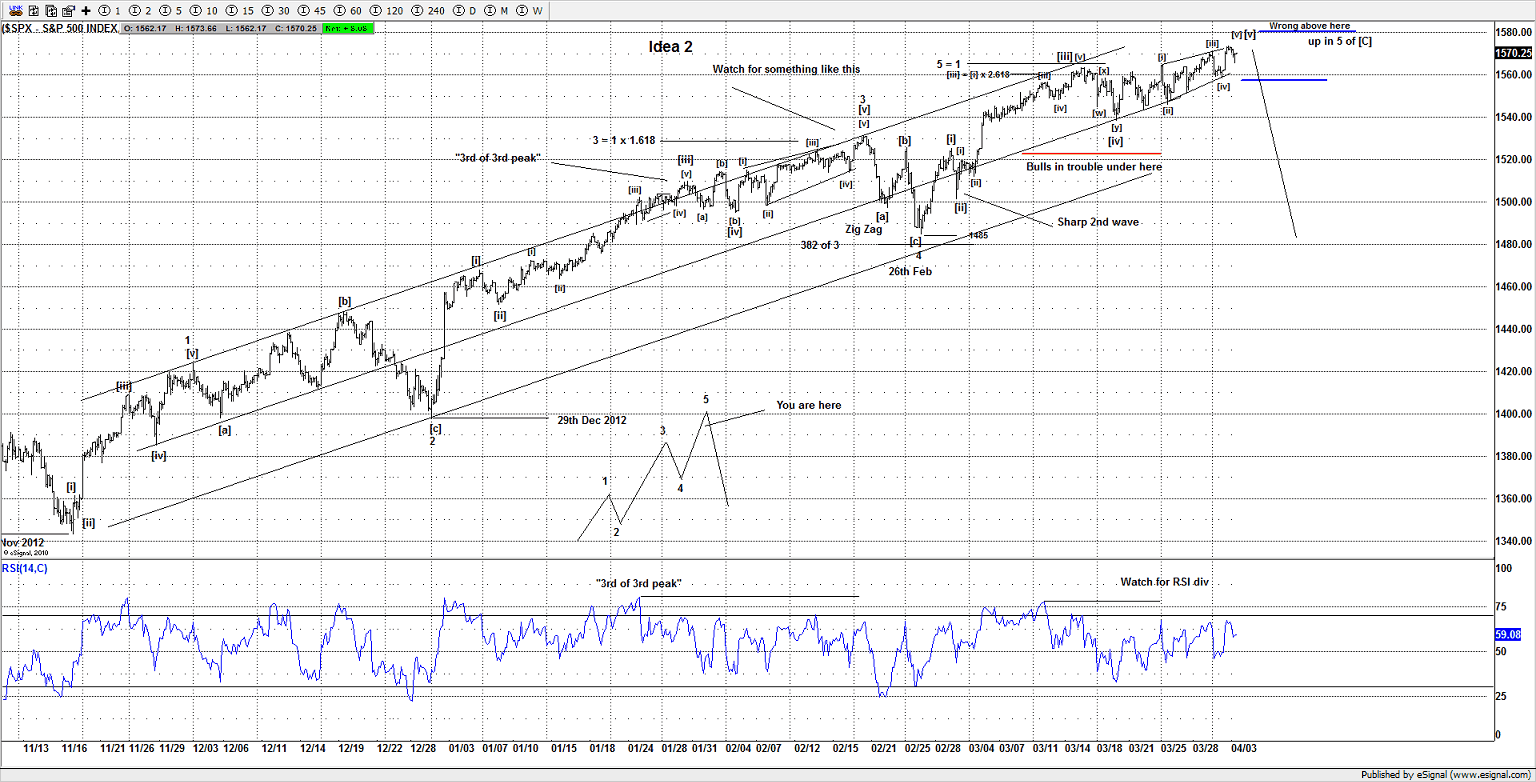
No matter which idea as long as its above 1558SPX the market is still bid.

I wont bore you with the daily chart idea, as that is not important, whats important is the structure appears to be a 5 wave move from the Nov 2012 lows and i suspect a reversal is close, we simply need to let the market commit and confirm which short term idea is in play.

Using Goldman and JP Morgan to Predict Turning Points

By -

A couple of stocks I like to follow are GS and JPM to
forecast pivot turning points in the US stock markets, particularly the SPX.

You can see how JPM and GS appear to be tracking the SPX
well and that it’s my belief that if we can track potential Elliott Wave counts
in both Goldman and JPM,we can find an edge to the US markets and use that
information to forecast major peaks and turns in the US stock markets.

If you overlay SPX, GS and JPM with each other, there is
a clear bonding between the 3 markets.

Tim1

(more…)

Struggling at Resistance (by Springheel Jack)

By -

I was saying in my weekend post at Marketshadows yesterday that if we are going to see the bullish scenario into 2013 fail, then the most likely place to see that failure is near the highs last week, as SPX tries to break over the weekly middle bollinger band. You can see that post here. Historically the odds for a break above are good, with fourteen moves to test the weekly middle BB from the lower BB in the last seven years, of which eleven broke back above, and of those nine then reached the weekly upper BB, now in the 1455 SPX area. However three of those did reverse at the middle bollinger band:

(more…)

Have We Begun the Final Rally? (by Avi Gilburt)

By -

On Tuesday night, I said we needed to maintain support over the 1394ES level in order to still view the upside as a reasonable possibility. On Wednesday we rallied off the overnight lows that held support over 1394. But the move up was an ugly pattern which seems to be best counted in waves of 3, so that we do not have to force an even more ugly count. This leads me to the conclusion that it is a possible leading diagonal. And, I have mentioned many times in the past how much I like to rely upon leading diagonals for trading purposes, but this is what the market has been giving us for 1st waves all too often.

Therefore, IF this is a leading diagonal, then either wave 2 has already completed in a very shallow manner, or we will see a much deeper wave 2, which is more typical of leading diagonals. But, if you remember the larger wave count I posted on the 60 minute chart today, the expectation was that wave 1 of wave iii was going to target the .618 extension at the 1406ES level, which is exactly what we seem to have gotten today. Therefore, based upon how we move up tomorrow, assuming we do see upside follow through, we will be targeting the 1412(1.00 extension) or 1416 (1.236 extension) levels for wave 3 of iii.

(more…)

Wave Count on AAPL (by Avi Gilburt)

By -

As I published over this weekend on ElliottWaveTrader.net and MarketWatch, our count seems to be following through quite nicely. Although we did expect more of a pullback on AAPL for its wave 2, it only provided a very small consolidation before it took off towards our next targets of 606 (1.00 extension) or 615/616 (1.236 extension).

We will then expect a pullback which should maintain support over the 597 region, especially if the 616 level is hit, and then rally again towards out next higher target region of 622-631. Ideally, AAPL should be there by the middle to the end of the month, if not higher if AAPL enters into the type of extensions that we have seen in the past.

Full-B8kgBPq7r3k7q5qo8xOX
Originally published on ElliottWaveTrader.net.