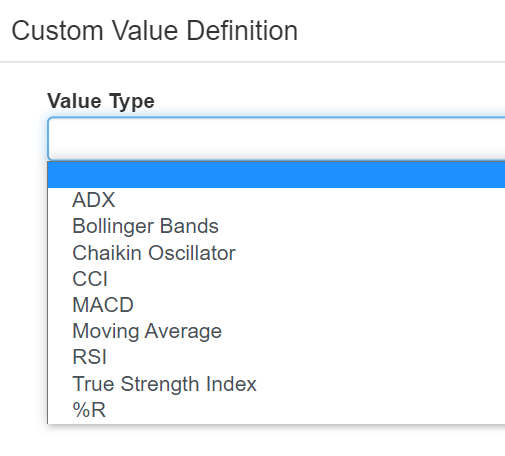
Good news for your SlopeRules users, both present and future: we’ve added a bevy of new rule types, as you can see here:
Slope initially began as a blog, so this is where most of the website’s content resides. Here we have tens of thousands of posts dating back over a decade. These are listed in reverse chronological order. Click on any category icon below to see posts tagged with that particular subject, or click on a word in the category cloud on the right side of the screen for more specific choices.
Good news for your SlopeRules users, both present and future: we’ve added a bevy of new rule types, as you can see here:
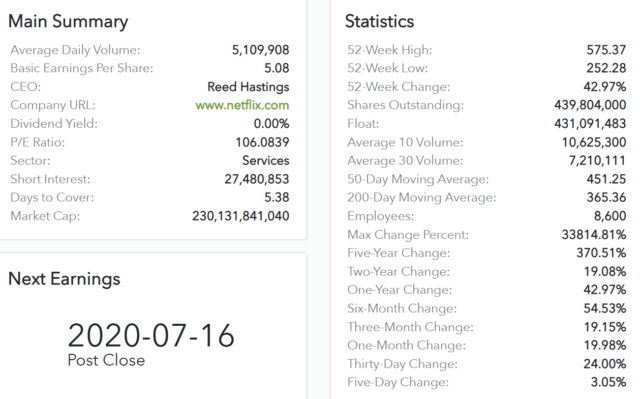
A glance at the oh-so-beautiful Quarterly Earnings page reveals that Netflix is the first exciting earnings report of the season after the close today. I think it’s easy to lose sight as to how many analytical tools are available here on the site. For Netflix specifically, here is a sampling, and it is not even exhaustive. Click on any of the links to learn more.
OK, folks, another “Tim thought of this when he was swimming” feature, and I think you’re going to love it. I’ve never seen anything like it anywhere else, and for now everyone can access it (in a little while, it’ll just be premium members). It’s called the Transformer feature.
The Transformer in SlopeCharts is a unique way to apply a formula to every single symbol you enter. This can be a tremendous time-saver if you want to have a customized perspective into any symbols you enter, particularly those within a watch list, since it is vastly more efficient to have the formula automatically applied as opposed to altering every symbol you want to see.
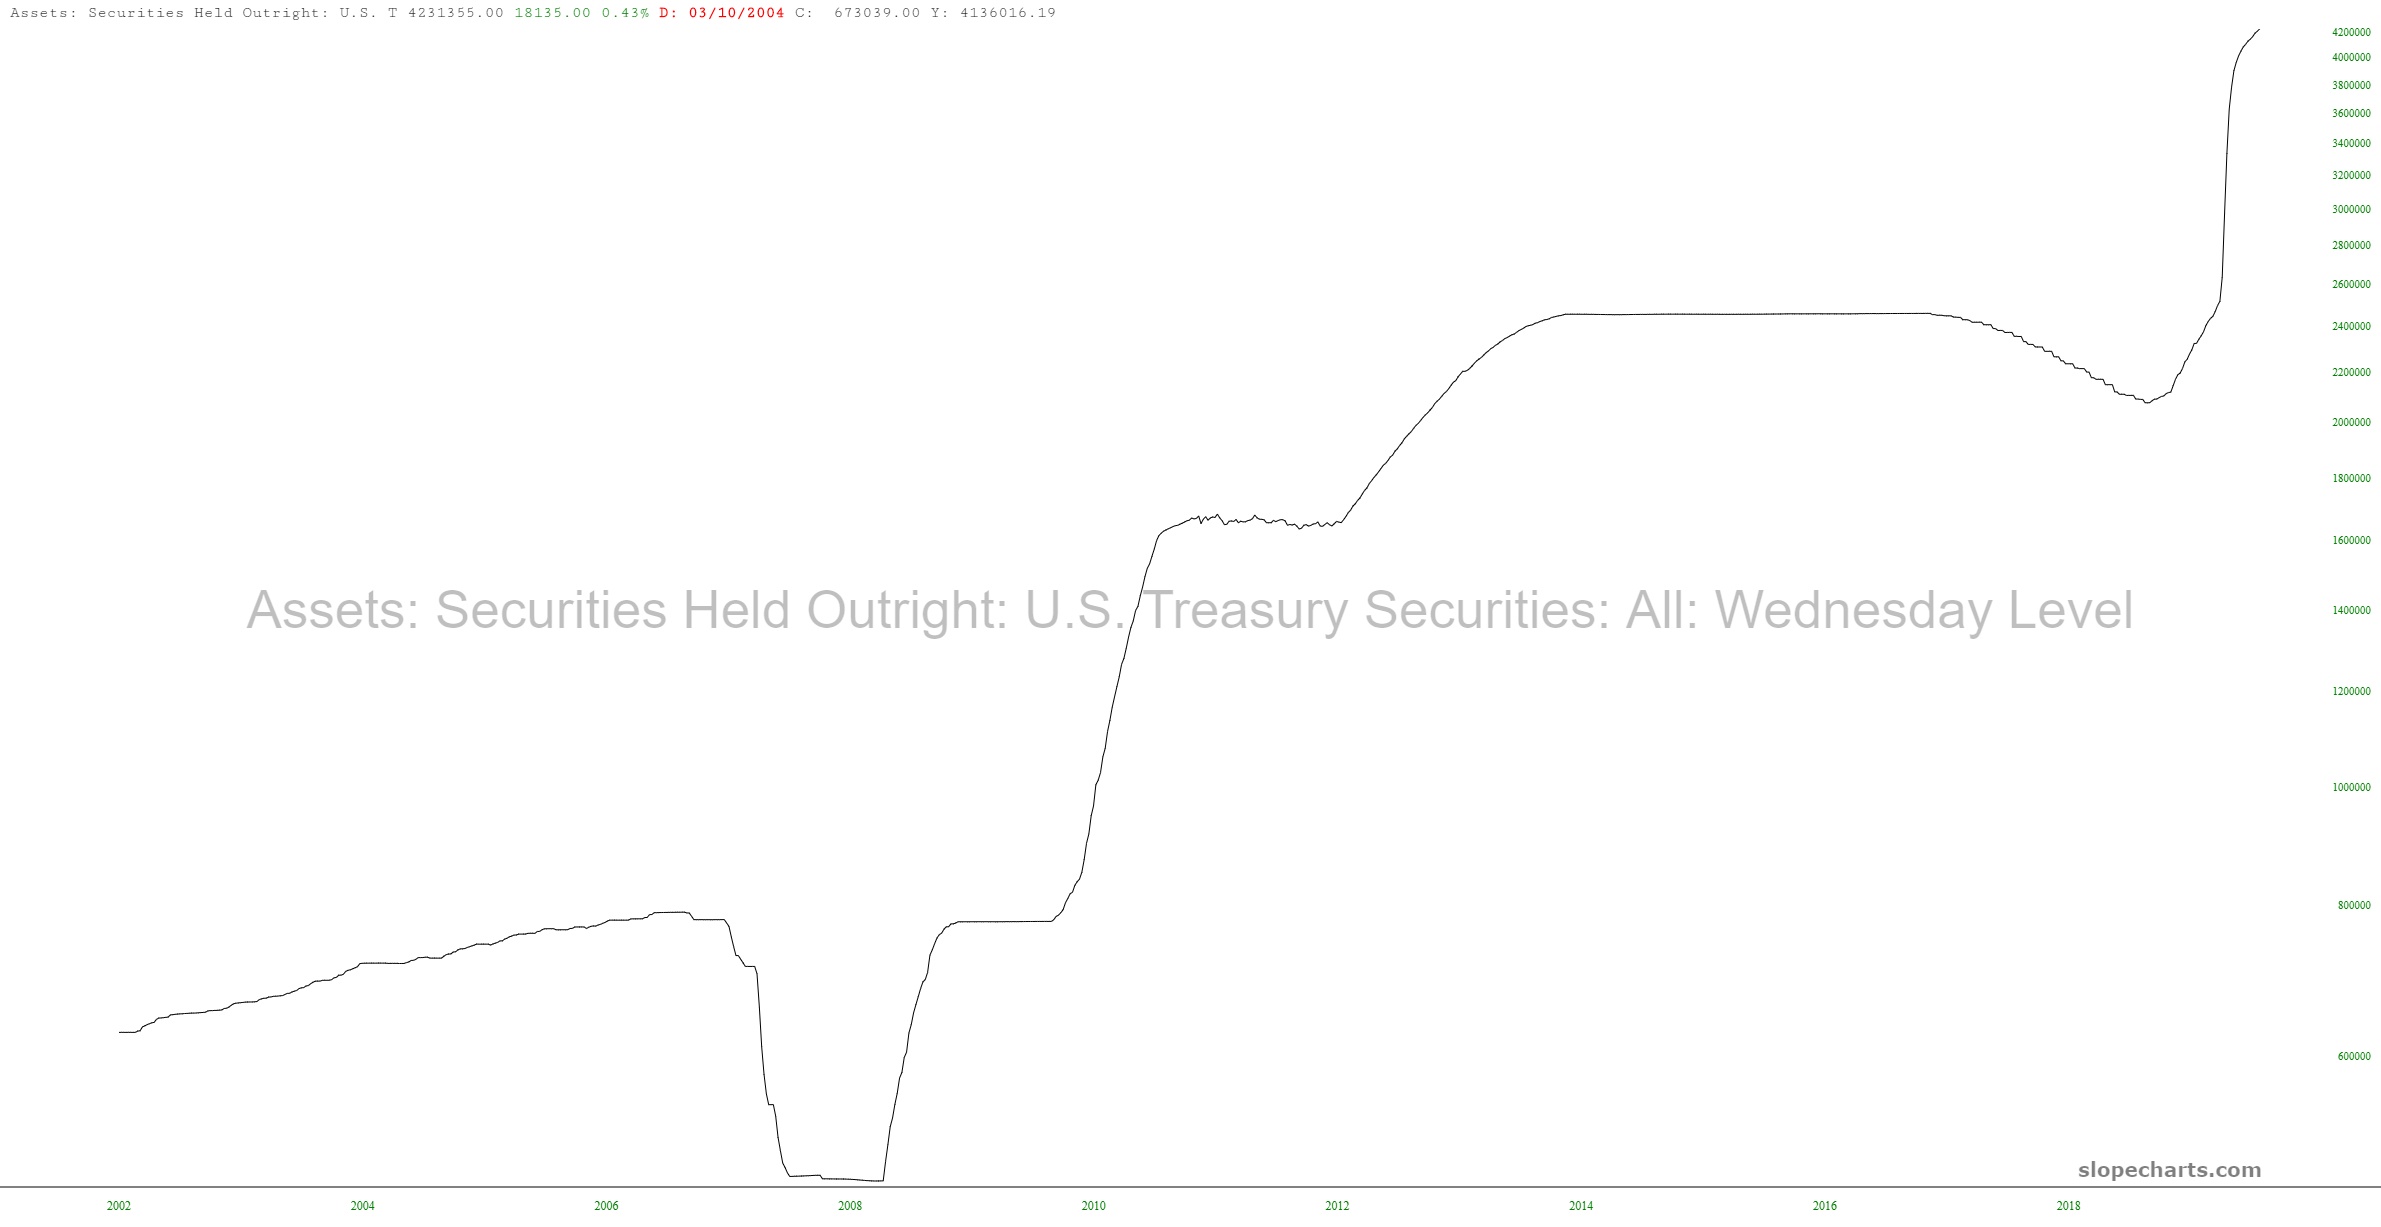
A very simple example would be if you wanted to view a series of assets proportionate to the Federal Reserve’s M2 money supply. In other words, you want to see every symbol divided by the M2 value. This new perspective might lead you to some important new insights.
(more…)As I was glancing at posts this morning, I stumbled across this comment over on ZH:

Hmmm! I had never heard of that! So July 5th to October 8th is some kind of sweet spot for gold, eh?
It occurred to me that instead of taking this oh-so-specific anecdote as Gospel, I actually might want to use our own Time Perspective in SlopeCharts to check it out. So here’s what I found:
(more…)