Incidentally, if you haven’t already, be sure to get the free Slope app, available now for Google and Apple devices!
Slope initially began as a blog, so this is where most of the website’s content resides. Here we have tens of thousands of posts dating back over a decade. These are listed in reverse chronological order. Click on any category icon below to see posts tagged with that particular subject, or click on a word in the category cloud on the right side of the screen for more specific choices.
Incidentally, if you haven’t already, be sure to get the free Slope app, available now for Google and Apple devices!
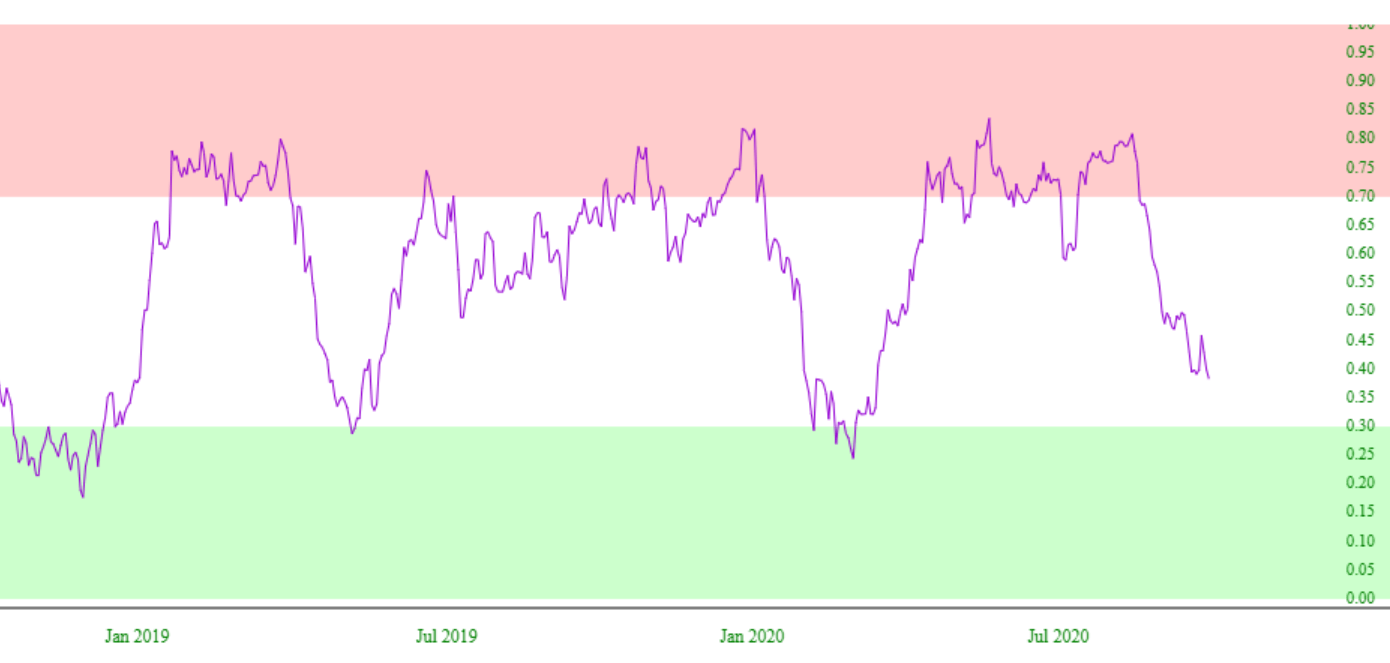
It has been a while since we’ve rolled out a new technical indicator, but by popular request, here it is: the DeMarker Indicator!
The DeMarker Indicator was created by famed technical analysis Thomas DeMark, and it is used as an overbought/oversold indicator. The range of the line chart is from 0.0 (most oversold) to 1.0 (most overbought). In SlopeCharts, we have helpfully provided shaded portions of the graph to make it very clear when the indicator enters and exits either of these zones.
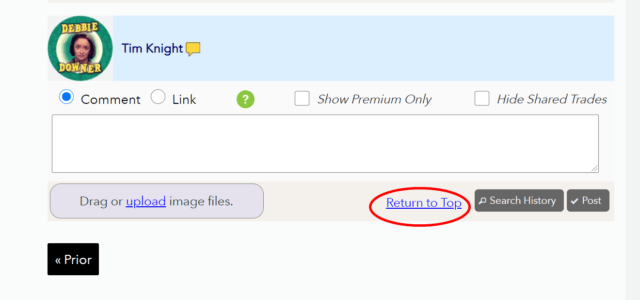
A couple of days, one of you wrote me and asked for a new feature in comments: a simple link that would send you rushing to the top of the post without having to scroll (which can be a pain if there are hundreds of comments, as there certainly will be on, oh, say, November 3rd).
Ask, and it shall be given!
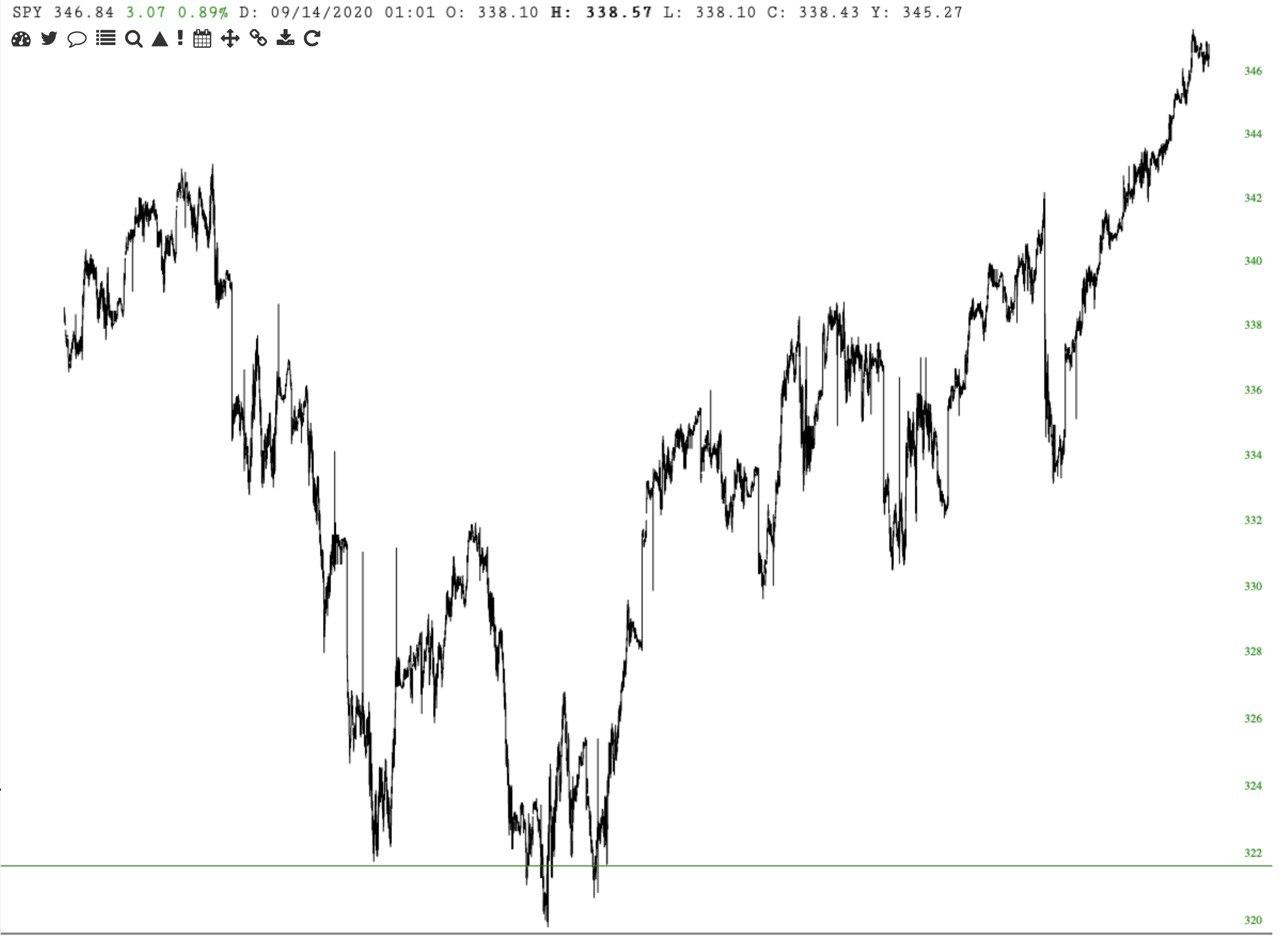
I know this is a minority of folks, but I wanted you to know that, at long, long last, intraday SlopeCharts works on Macintosh!
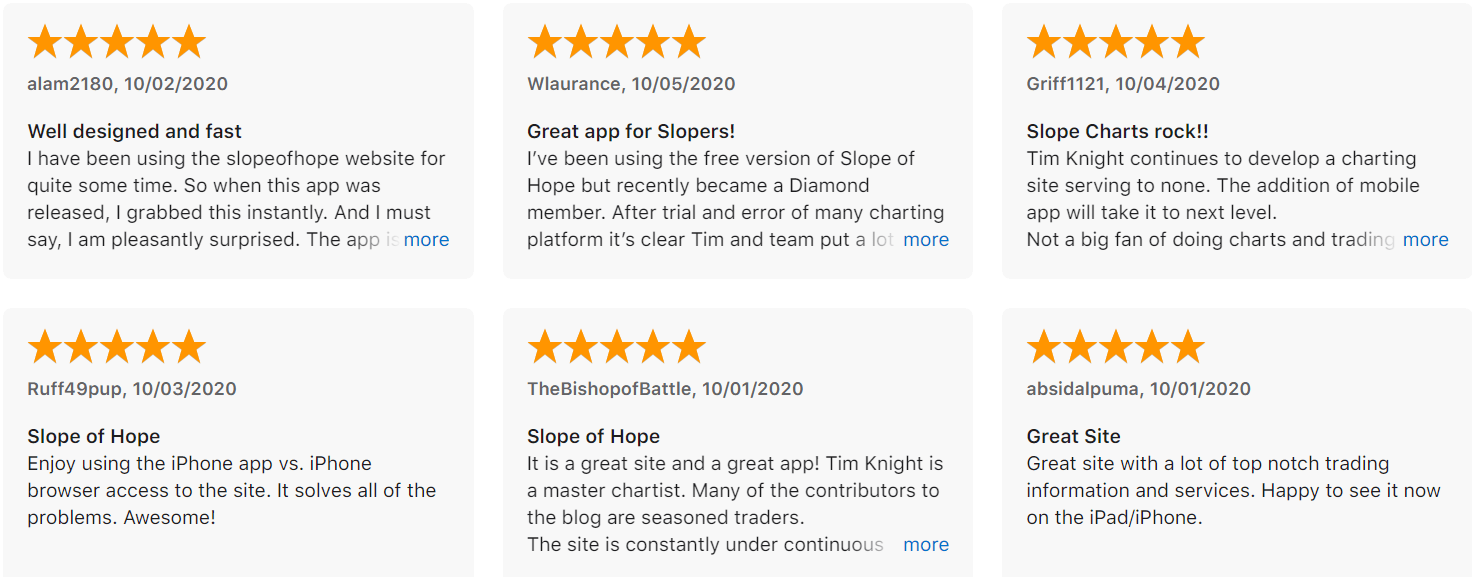
It goes without saying (but I’ll say it anyway) that the biggest news in Slope-land has been Slope Mobile, which is getting dynamite reviews (I was actually a little saddened that we’re at 4.9 stars instead of a perfect 5.0, but, hey, not everyone is going to give me a perfect score!) Android and iPhone folks, get your free app!