I was bemoaning to poor quality data of $SPX50MA yesterday (I mean, right, who hasn’t? We’ve all been there!) I’m pleased to report it is as clean as a whistle now.

Slope initially began as a blog, so this is where most of the website’s content resides. Here we have tens of thousands of posts dating back over a decade. These are listed in reverse chronological order. Click on any category icon below to see posts tagged with that particular subject, or click on a word in the category cloud on the right side of the screen for more specific choices.
I was bemoaning to poor quality data of $SPX50MA yesterday (I mean, right, who hasn’t? We’ve all been there!) I’m pleased to report it is as clean as a whistle now.
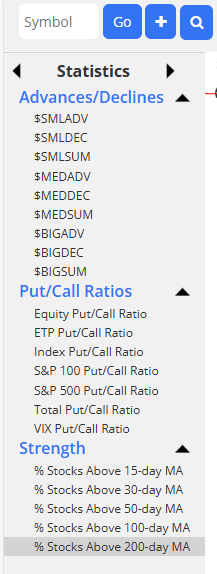
Just a gentle Saturday reminder that in SlopeCharts one of the panels is for market Statistics.
In my last post on 16th July I was looking at a significant high that may be forming here on equities. There was some unfinished business that I was looking to finish on the upside and one of those was a high retest on DIA which we saw yesterday and there is now a daily RSI 14 sell signal brewing on DIA to go with the daily sell signals already fixed on SPX, QQQ and IWM.
I went through a more thorough list of the unfinished business both finished and remaining on my The Bigger Picture video yesterday night but in brief I was looking on my premarket videos over the last few days for high retests on DIA and Nikkei, which we saw yesterday, a full all time high retest on INDU, not quite seen yesterday but close, and high retests on DAX and ESTX50, both of which have formed bull flags which have broken up but not yet made target.
(more…)Back in my post on 11th April I called the likely start of a strong rally which we then saw.
Back in my post on 12th May I called for new all time highs on Bitcoin (BTCUSD) and laid out possible IHS scenarios on both Solana (SOLUSD) and Ethereum (ETHUSD), looking for ideal right shoulder lows on Solana in the 125.43 area and on Ethereum in the 2074.27 area. That hasn’t gone quite as I drew then but essentially both are still running that scenario.
Back in my post on 23rd June I called the likely lows on those right shoulders made on Solana at 126.09 and on Ethereum at 2113.65, and was looking for that IHS scenario on both to start to play out.
In my last post on 18th July I was looking at the IHS that had since broken up on Ethereum and the progress made towards the IHS neckline on Solana.
(more…)Here below is a heat map showing the probability of reversal for a number of US markets I track.
NVDA and GOOG and AMZN are overbought (the latter is less overbought than its peers, only 68% prob. of reversal).
META sticks out as the sore loser: it has been down for 3 weeks, and it is quite oversold, overall 82% probability of reversal.
(more…)