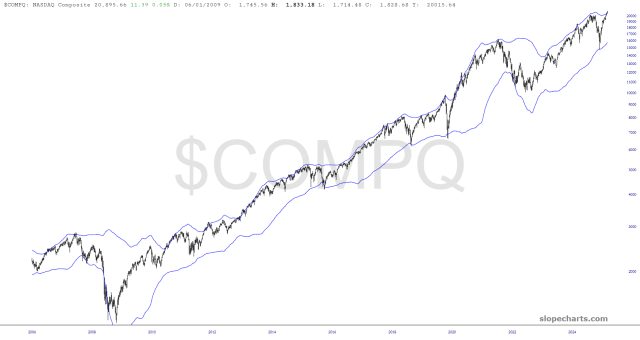
Back on Tuesday 3rd June I laid out a possible bullish scenario in which I was looking for retests of the all time highs on SPX and NDX, with follow-on targets if both ran higher, a retest of the all time high on INDU, and a possible longer shot retest of the all time high on IWM based on a large IHS. Since then we have seen all three of those new all time highs on SPX, NDX and INDU, and the IHS on IWM has broken up hard and made it slightly less than halfway to the target at a retest of that all time high.
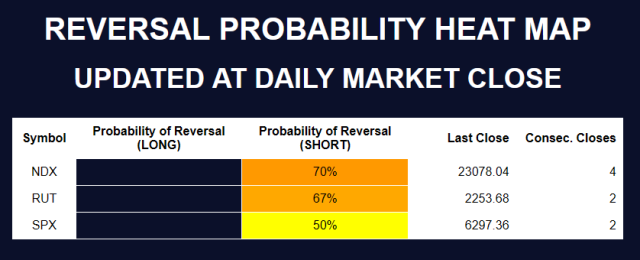
What we haven’t seen yet is the further extension to the possible trendline targets that I was looking at on SPX into the 6450-6500 area, or on NDX into the 24000-24500 area, or the new all time high on IWM of course, but I think this rally is likely now very close to at minimum to a steep retracement and may currently be making the highest highs that we will see in 2025.
(more…)