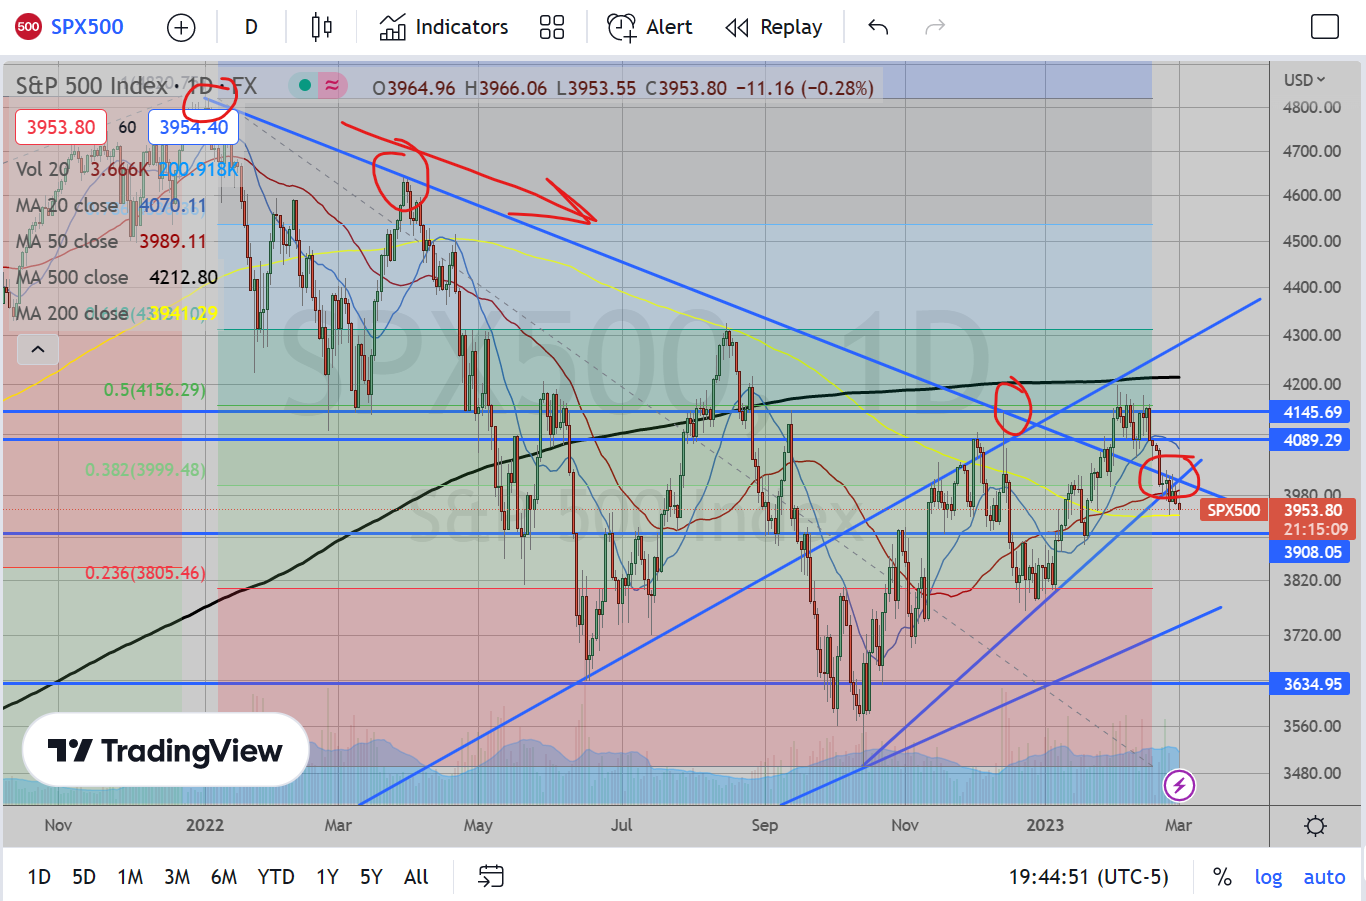
Slope of Hope Blog Posts

Slope initially began as a blog, so this is where most of the website’s content resides. Here we have tens of thousands of posts dating back over a decade. These are listed in reverse chronological order. Click on any category icon below to see posts tagged with that particular subject, or click on a word in the category cloud on the right side of the screen for more specific choices.

Very Important Resistance Area Here

By -

The possible H&S I was looking at on Friday morning didn’t form and the move to retest the prior high has done some interesting technical damage to the bear case, so I wanted to have a look at that this morning.

The SPX hourly chart below shows the break over declining resistance from the all time high, which held perfectly at the December highs and established a high quality three touch resistance trendline.

On the bigger picture there is also a decent case that a falling wedge has formed from the all time high on SPX that could be a bull flag. That flag wedge would have underthrown bullishly at the October low and this might therefore be the start of a break up towards a possible retest of the all time high.

(more…)

Mr. Wizard’s Epic Post (3 of 3)

By -

You can click here for Part 1 and here for Part 2.

Can Caped Crusaders rescue us?

Another valuation method is the Shiller CAPE 10, which stands for Cyclically Adjusted PE Ratio, with a period of 10 years. This metric is cited quite often when claims are made the market is overvalued.

Resources:

http://www.econ.yale.edu/~shiller/data.htm

https://www.multpl.com/shiller-pe

Shiller’s thesis (literally) was that averaging earnings over a period of several years created a valuation measure that could be used to predict future returns, since the longer period tended to smooth out the ups and downs of the economy and give a more accurate picture of corporate fundamentals. The same data we used in the trendline construction can be used to plot the Shiller CAPE.

(more…)

Mr. Wizard’s Epic Post (1 of 3)

By -

Preface from Tim: Our beloved Mr. Wizard composed an enormous post, long enough to be seen from space. I have broken it up into three roughly equal parts, to be published over the course of the weekend. Hearty thanks to Wiz!


Predicting the S&P

Can We Do Better Than Highly Paid Analysts?

At the end of every year, fund analysts and stock pundits fall all over themselves predicting ever higher and higher prices at where the S&P will close for the coming year. These predictions usually go something as follows: “Our analysts estimate S&P earnings for 2023 will be $240. Coupled with a conservative PE of 17.4, we believe the S&P will close 2023 at 4176.”

So we have an “estimate” for the first number, earnings, and a guess for the second number, the PE multiple. How well do these analysts do?

To be blunt: not very well.

(more…)