I was saying in my post on Monday that a fail at the test of the daily middle band generally happens in one of two ways. The first way is the usual test and fail, and the second is a break above that is rejected the next day. Obviously SPX took the second option and delivered a memorable rejection candle. That was bearish with an obvious minimum target at a retest of the daily lower band, which closed yesterday at 3823. I’m expecting that target to be reached, and likely lower. A retest in the next few weeks of the 2022 low at 3636.87 is now firmly on the table as my primary scenario.
(more…)Slope of Hope Blog Posts
Slope initially began as a blog, so this is where most of the website’s content resides. Here we have tens of thousands of posts dating back over a decade. These are listed in reverse chronological order. Click on any category icon below to see posts tagged with that particular subject, or click on a word in the category cloud on the right side of the screen for more specific choices.
Halfway Between the Gutter & Stars
SPX rallied further on Friday to test the monthly pivot at 4078, and has been trading above it overnight. A string of decent quality double bottoms have broken up on the equity indices and if we are to see further upside then the next big resistance on SPX is at the daily middle band which closed on Friday in the 4108 area. This brings us to a big inflection point that should determine direction for the next few weeks.
On the bear side the daily middle band should hold as resistance. That can either happen with a fail directly at or under the daily middle band, or with a break above it that fails to follow through to convert it back to support. That would normally be delivered with a clear break above it that then rejects back below it the following day.
(more…)Back On The Three Day Rule
I was saying on Wednesday morning that the most important short term resistance was the 5dma, and we saw a break back over the 5dma at the close on Wednesday, so that put SPX back on the Three Day Rule. That means that in the event of a clear visual break (3 to 5 handles) back below the 5dma on either of the next two trading days, in this case yesterday or today, then SPX should retest the last low at 3886.75 before any retest of the prior high at 4325.28.
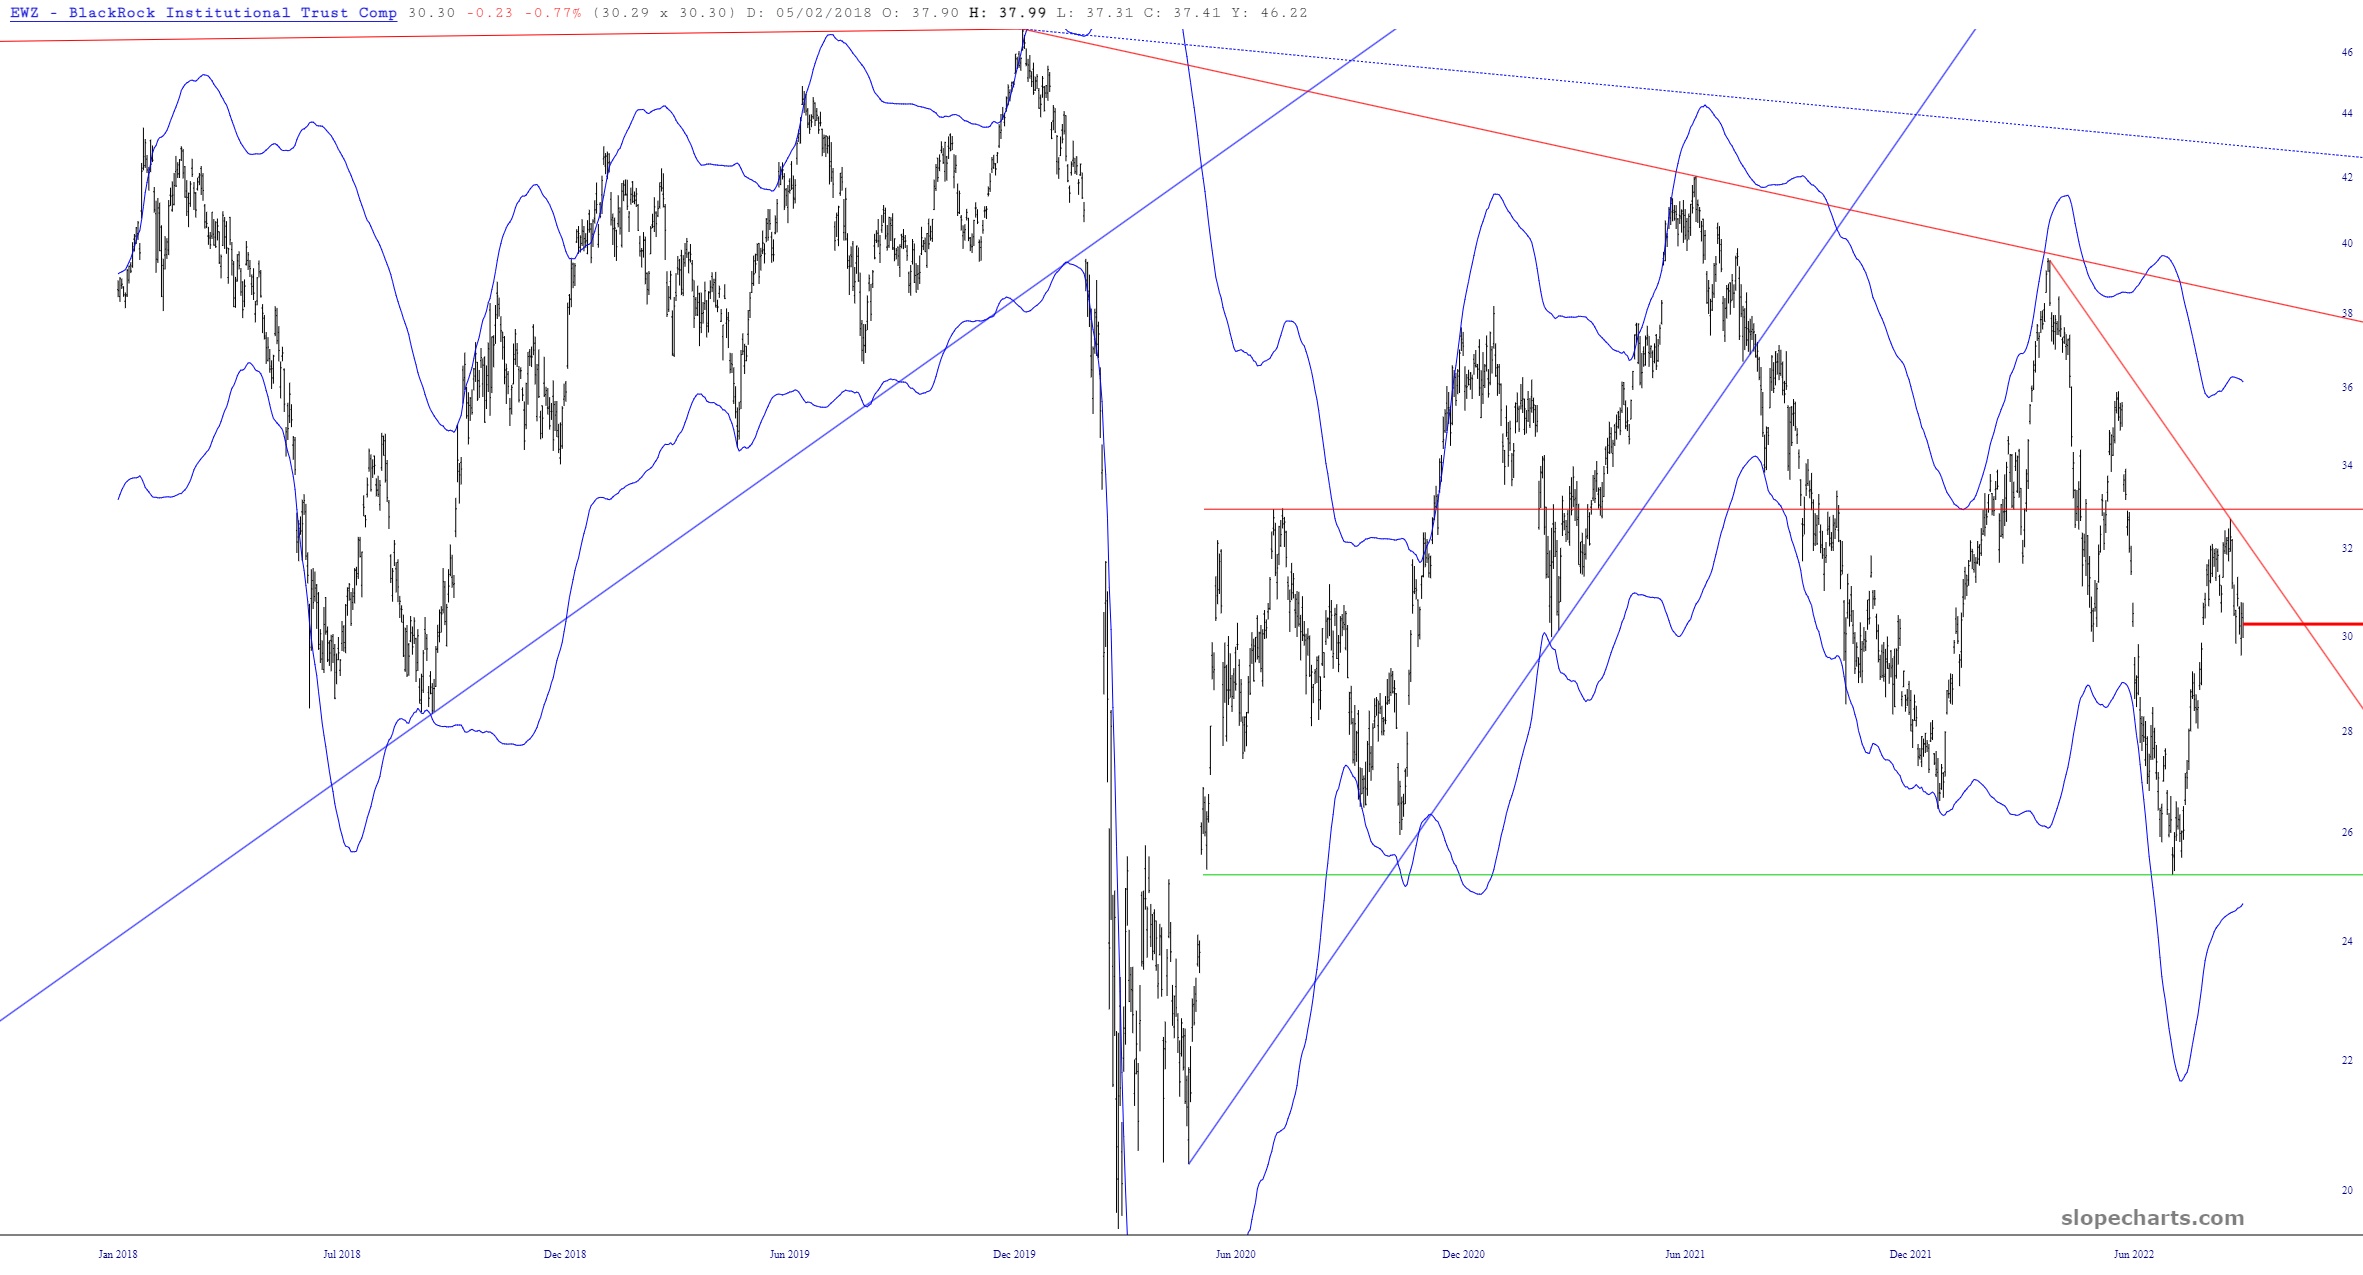
(more…)Brazindicators
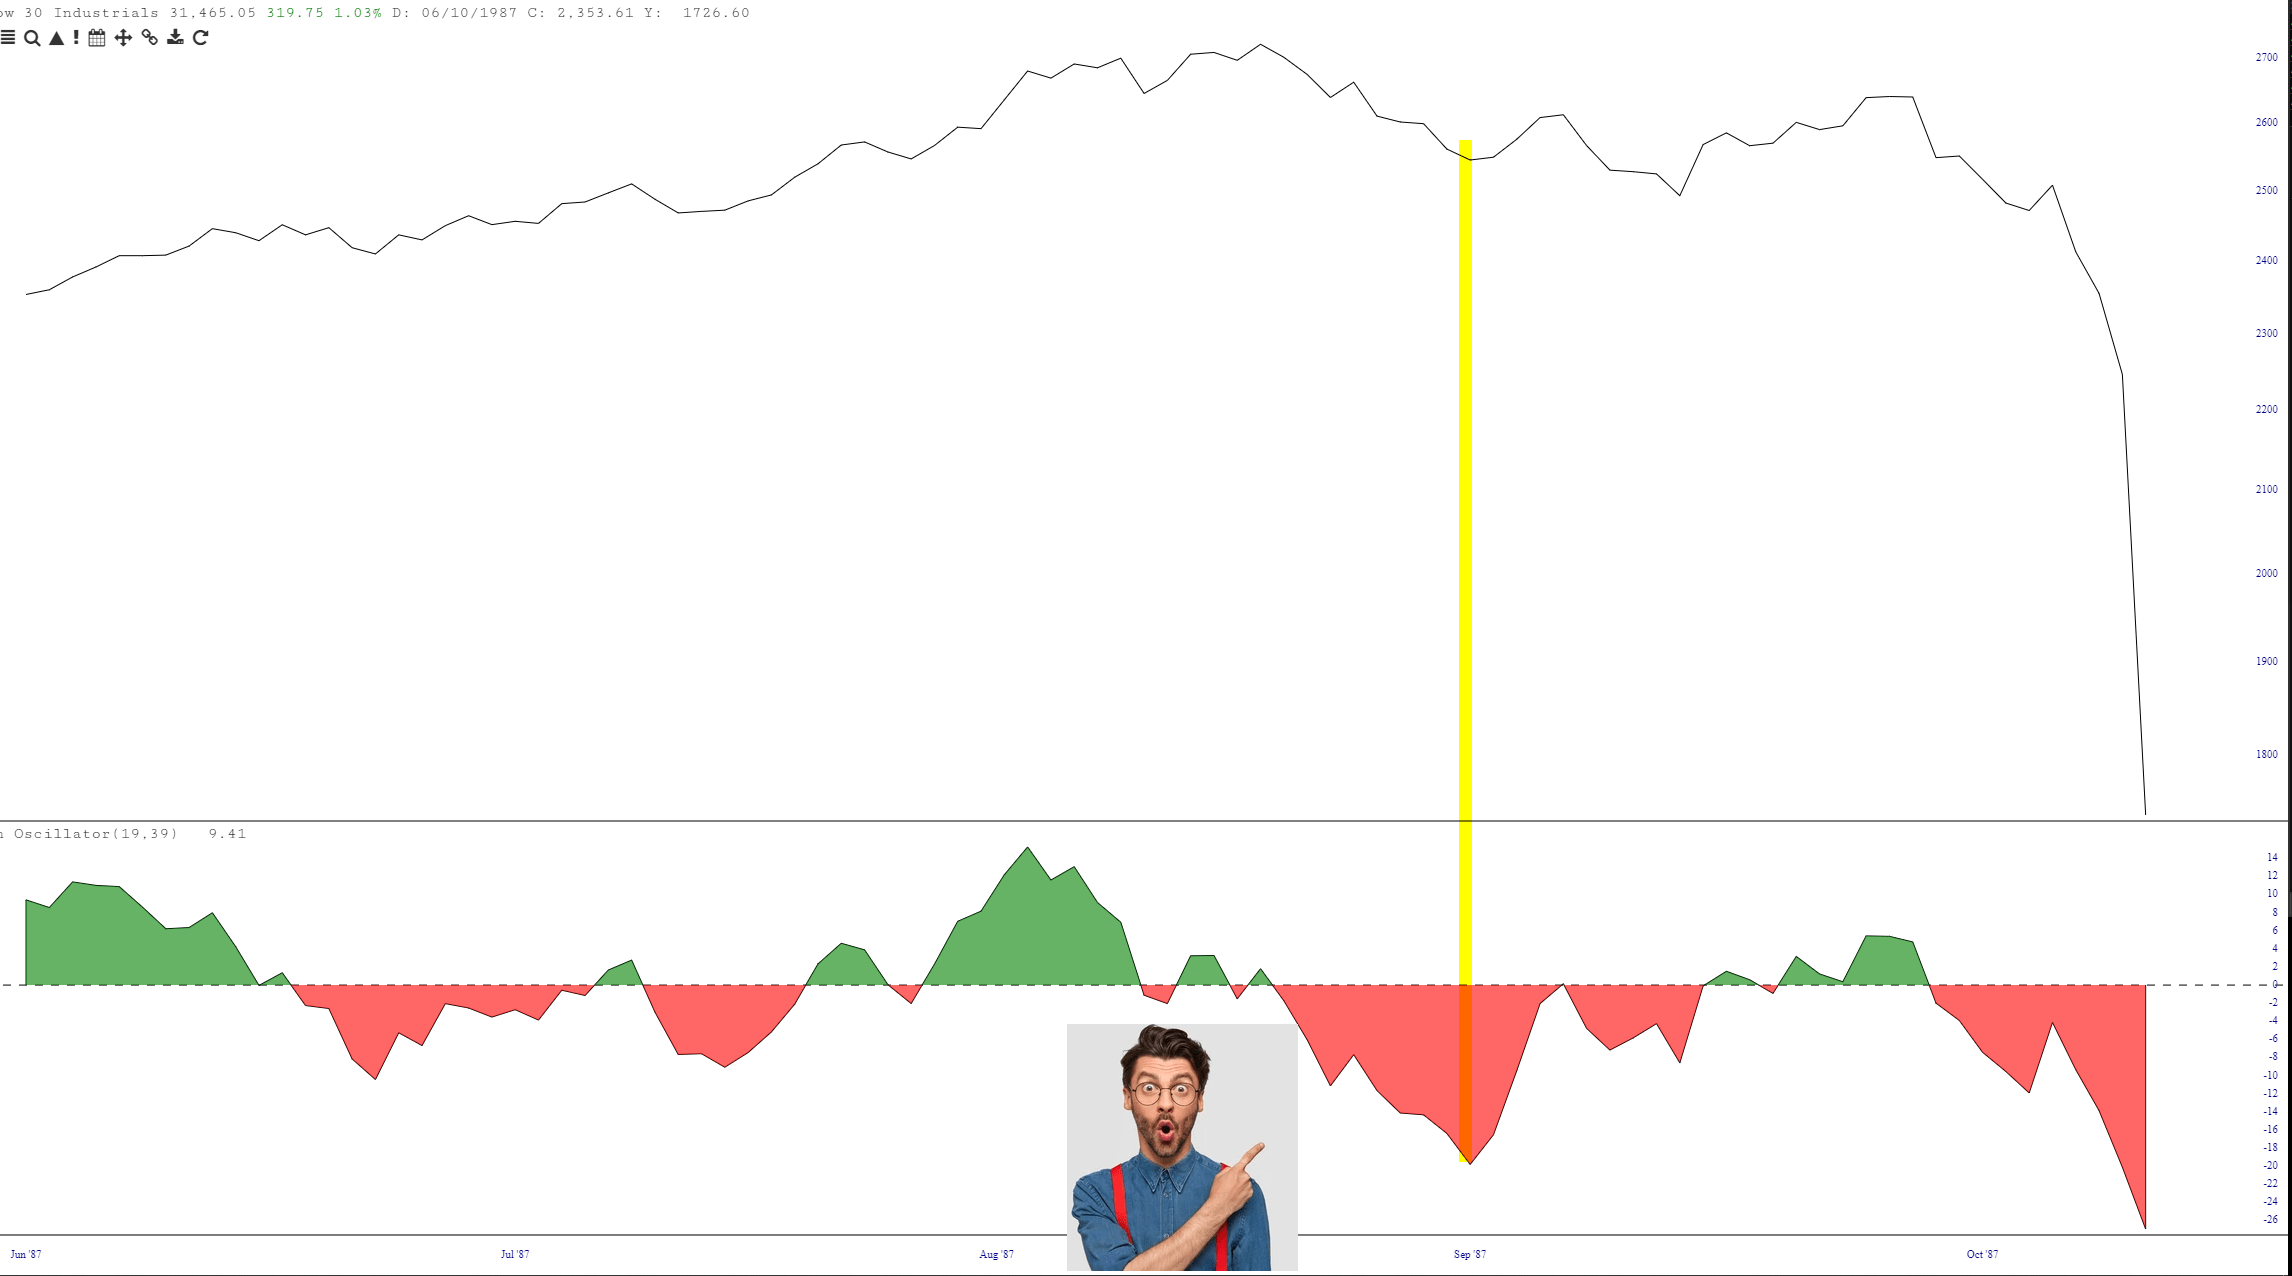
Keep Feeling Oscillation
This was more relevant early this morning before our melt-up, but it still holds true: I’ve seen many mentions lately about how the McClellan Oscillator is more oversold than it has been all year long, and surely this must mean the market bottom. Allow me to offer this chart from 1987, and in particular where the chap is pointing out a similarly Most Oversold EVER McClellan for all to see. I have tinted this point on the price chart in yellow. As you can clearly see, all that happened afterward was that the market “burned off” the oversold nature of the market and, soon enough, completely crashed into oblivion. Just sayin’.