
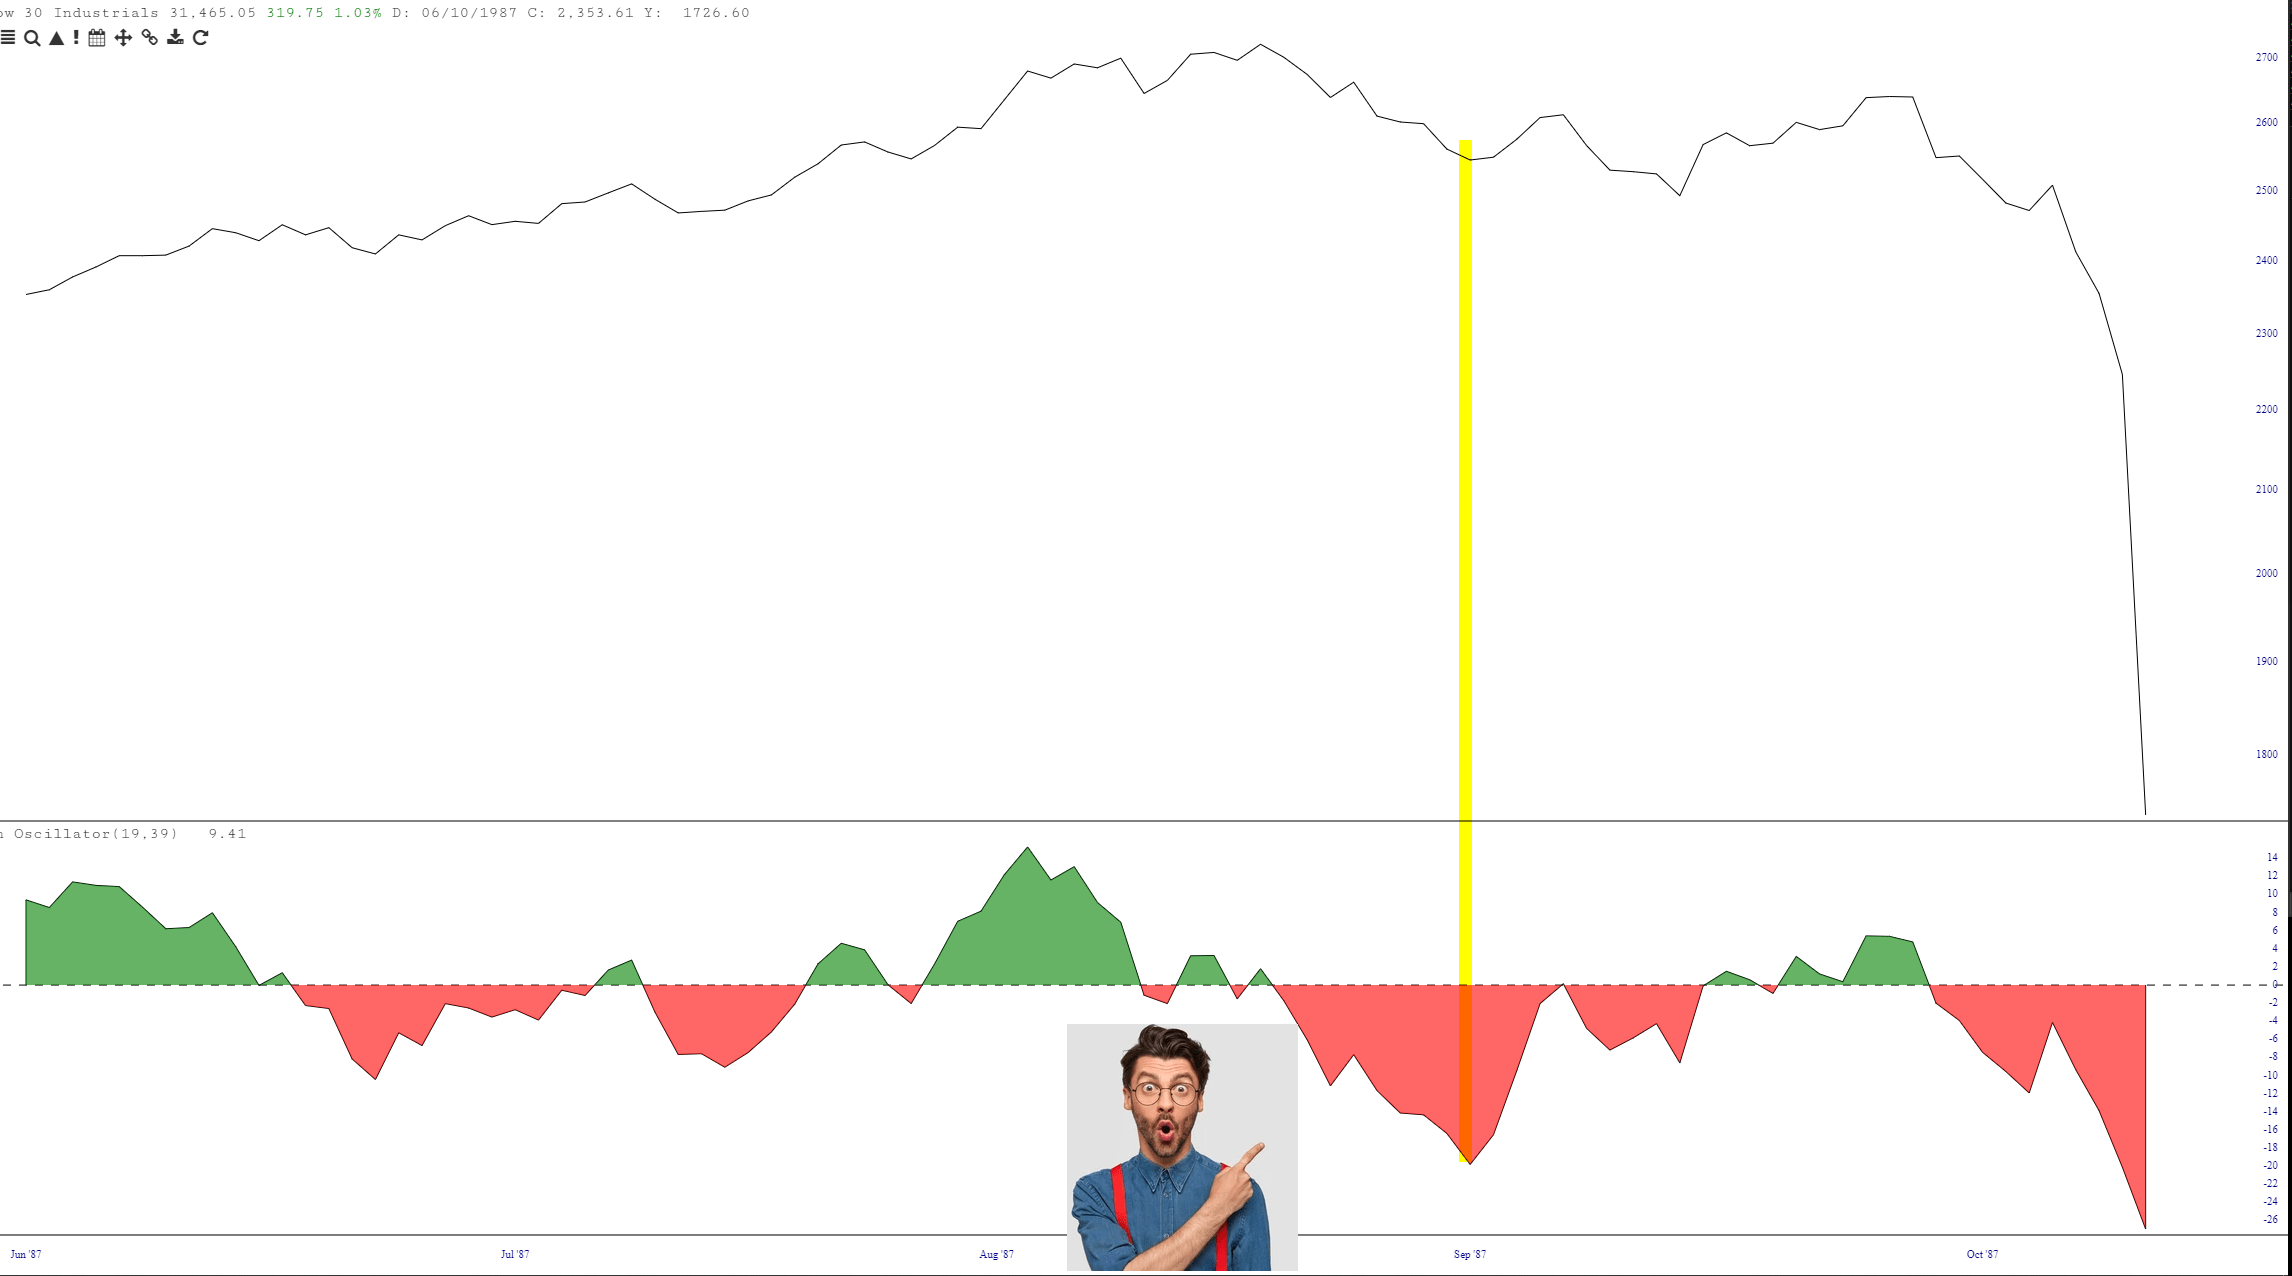
This was more relevant early this morning before our melt-up, but it still holds true: I’ve seen many mentions lately about how the McClellan Oscillator is more oversold than it has been all year long, and surely this must mean the market bottom. Allow me to offer this chart from 1987, and in particular where the chap is pointing out a similarly Most Oversold EVER McClellan for all to see. I have tinted this point on the price chart in yellow. As you can clearly see, all that happened afterward was that the market “burned off” the oversold nature of the market and, soon enough, completely crashed into oblivion. Just sayin’.
For my own portfolio:
- I trimmed some positions, both in size and quantity;
- I increased my energy shorts somewhat;
- I went from 0% cash to 22.7% cash;
- I now have 28 positions;
- In a super Not-Like-Tim-At-All move, even though I am loaded to the teeth with January 2023 puts (135 days left on them), my biggest position, which I acquired an half an hour before the close, is September 16th $400 SPY puts (only 9 days left!!!!!)
Today was the first losing day I’ve had in a while, but at least it took a lot of the oversold-ness out of the market with a melt-up.
