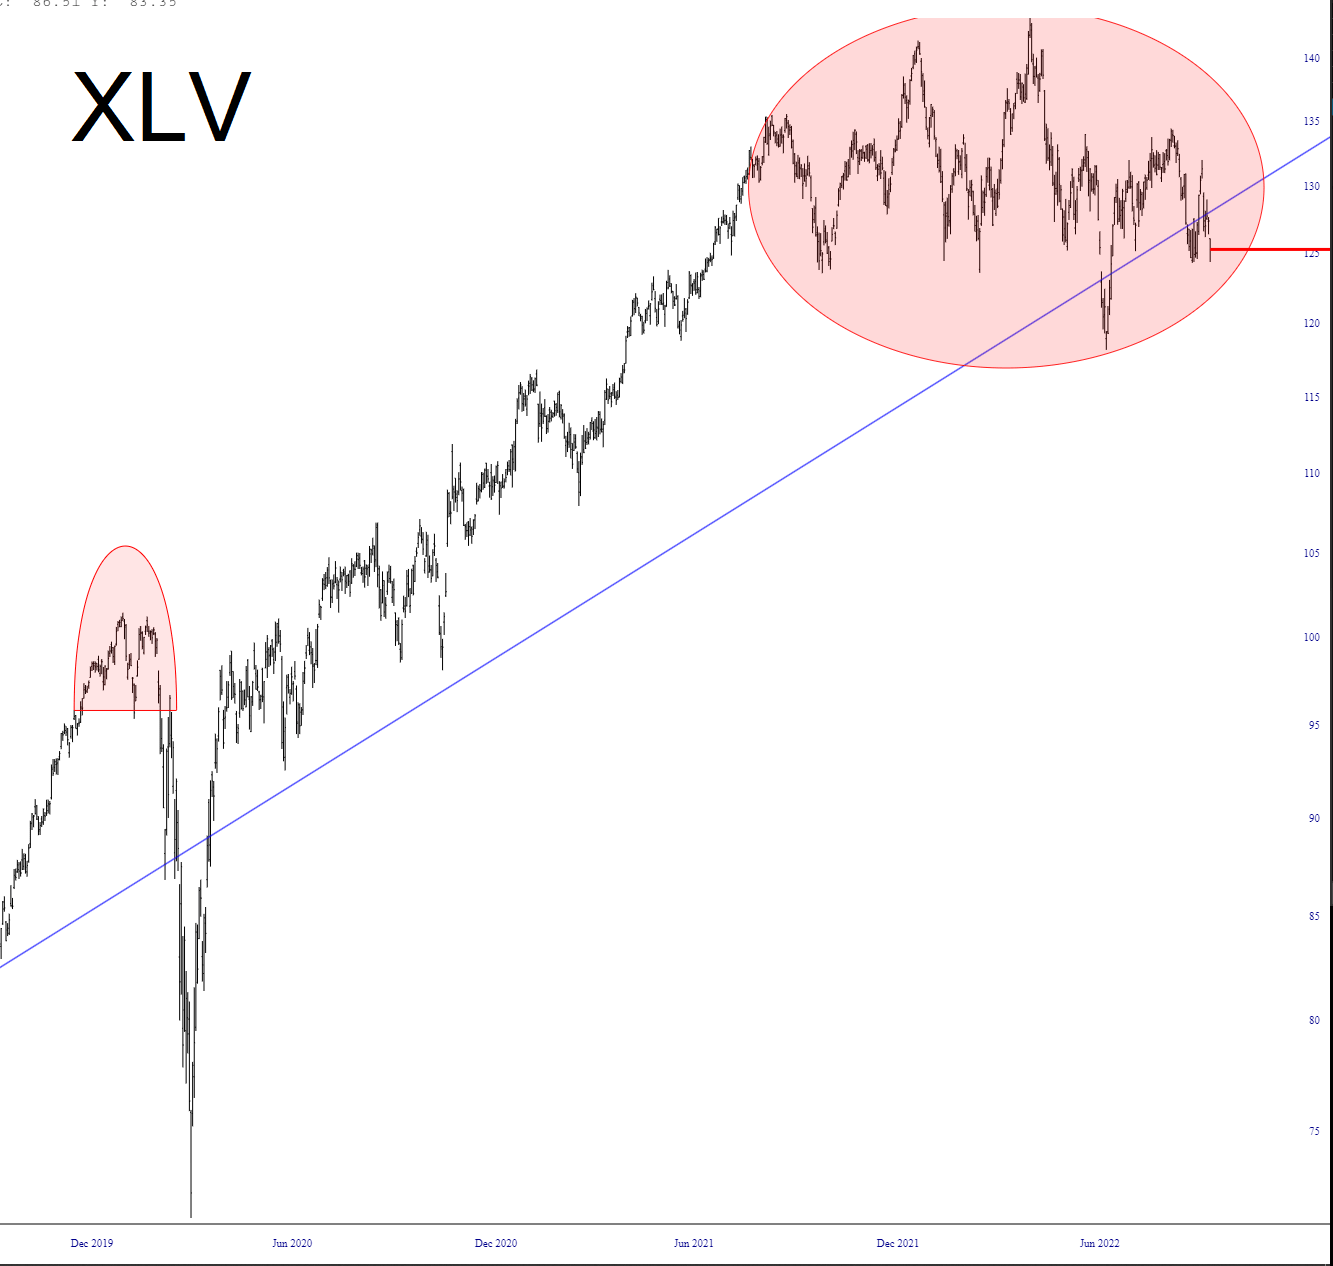
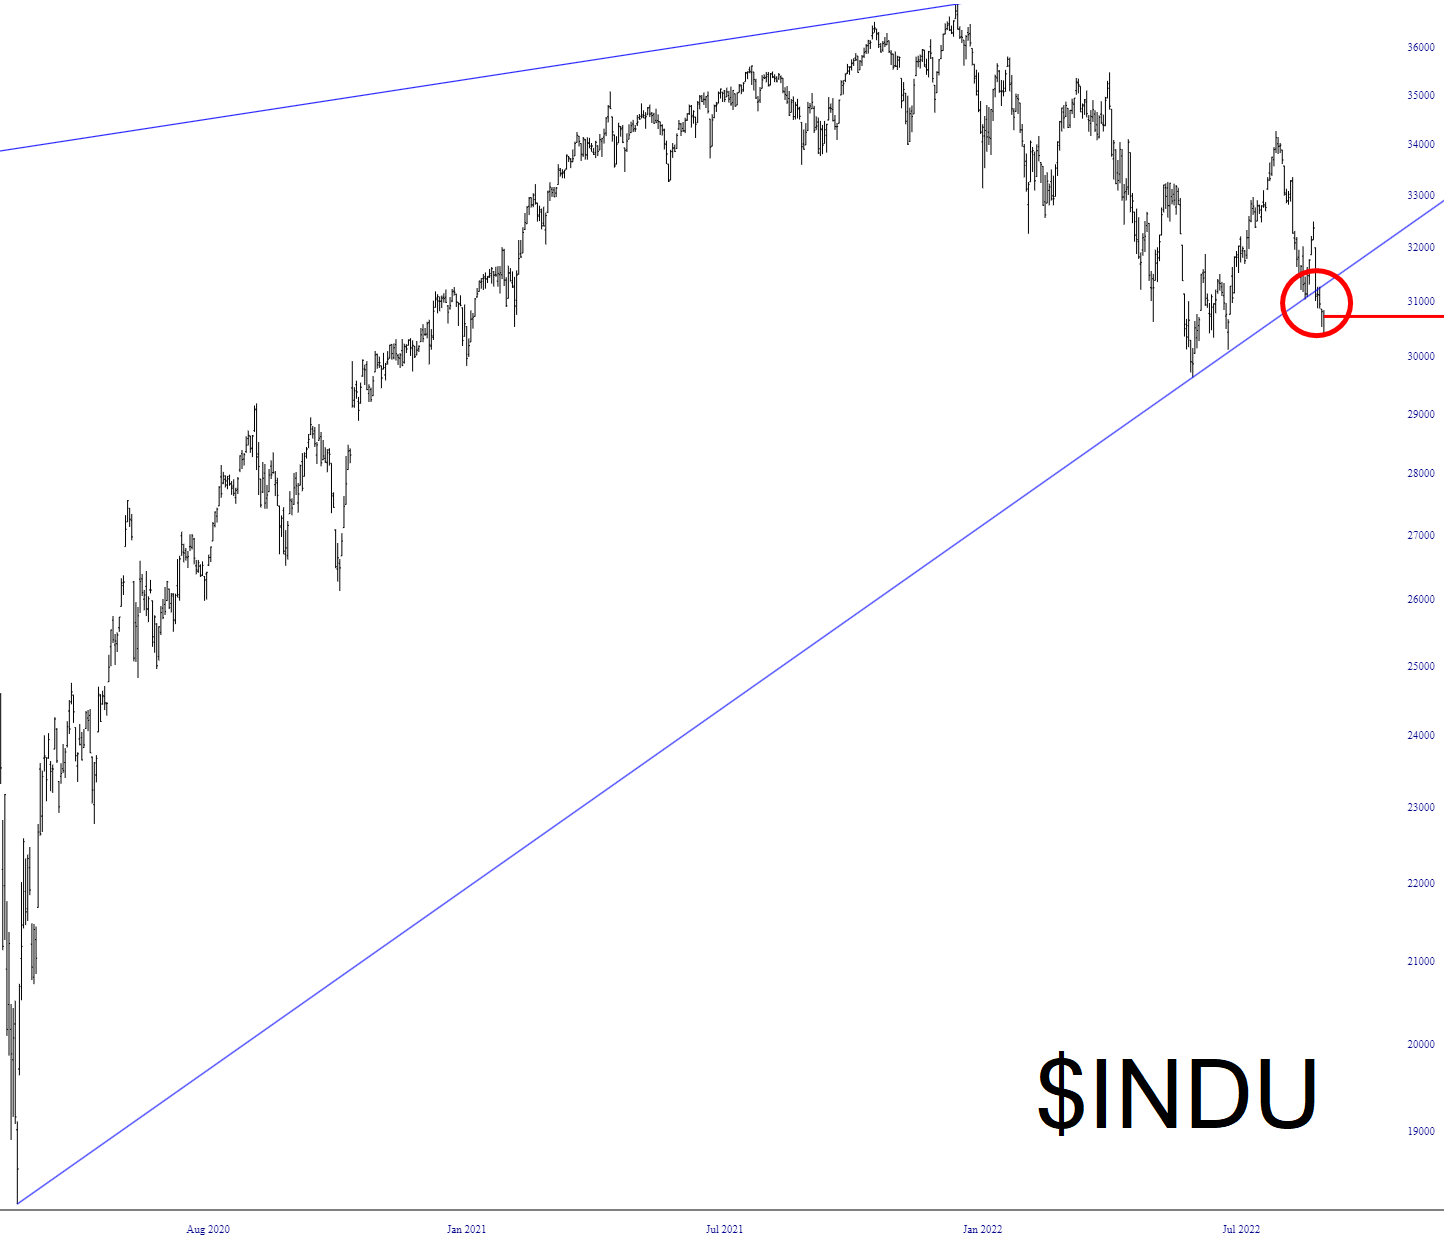
You wrote a book on the subject of financial panics, so here’s a question: should bears use linear charts for help with predicting eventual bear market lows? Not necessarily for a price target, but more to understand the scale of what’s coming.
I thought of this when looking at Home Depot after your post, because it looks like a perma-riser chart about to break support (huge event by itself) , but when I changed the view to linear, it looks like an obvious bubble since maybe 2009 with a possible stretch target of $22. The $50 area looked like the biggest support area after Covid lows until I saw the linear chart.
(more…)