Slope of Hope Blog Posts

Slope initially began as a blog, so this is where most of the website’s content resides. Here we have tens of thousands of posts dating back over a decade. These are listed in reverse chronological order. Click on any category icon below to see posts tagged with that particular subject, or click on a word in the category cloud on the right side of the screen for more specific choices.

Air Getting Very Thin Here

By -

I was talking on Friday about how every so often we see market moves that make no sense, but are technically sound, and go ahead and happen despite making no sense.  I was calling these grey swans and as it happens there was a very good example of this that day.

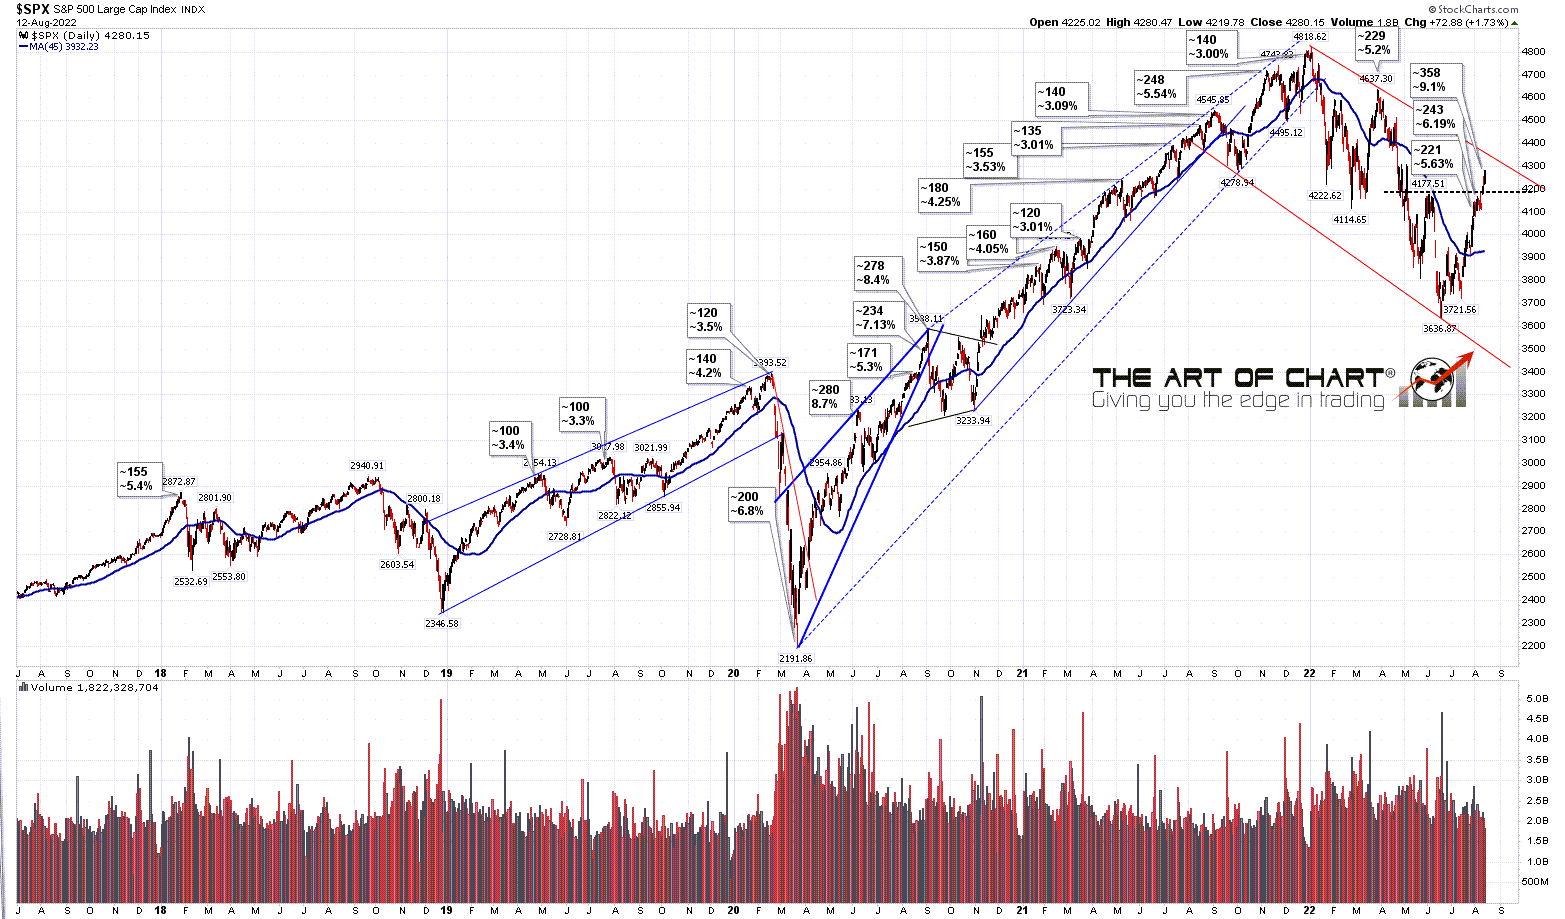
On my daily 45dma chart at the intraday high SPX reached a level 9.1% above the 45dma, higher than both of the highs made after the 2020 low at 8.7% and 8.4%. That was something I didn’t expect to see, but here we are.

SPX daily 45dma chart:

(more…)

A Difficult Prospect (by XerxesTraderGF)

By -

I’ll start by stating the obvious: It’s been a rough month to be a bear. I had warned about 3920 being a devastating technical level should we break above it. I’ll also admit that my “warning” was more for myself as others were already sounding the BULL alarm prior to that, but that was my technical level to watch. SPX successfully broke above that descending channel on July 19 and has continued a powerful rally since then, breaking through an important technical resistance zone, specifically 4080-4180. And here we are now thrust up just under 4300. Trying to come up with a bearish case is a very difficult prospect given this straight shot up. However, I would expect some volatility to reenter the market at the nearby technical levels as I expect anyone who got long near 3900 would like to take some profits near 4300 at the very least.

(more…)

Grey Swans

By -

I wanted to take an opportunity to take stock of where this rally is in relation to the possible all time high retests that I was talking about in my post on 14th June just before the 2022 low was made. I have done three main posts looking at this and a possible news background that might help deliver those high retests from the decent looking bull flags that have formed in 2022 on all four of the main US indices that I watch from those all time highs

These are those three posts which are worth another look as there is more in them than I will be reviewing in this post.

Through A Glass Darkly – 14th Jun

Blood In The Streets – 17th Jun

The Evolving Markets – 8th Jul

(more…)

Still In The Inflection Point

By -

If you missed our free public Chart Chat at theartofchart.net on Sunday then you can see the recording here or on our monthly free webinars page here.

In that Chart Chat we were saying that a retest of the rally high was likely early this week, and we saw that yesterday. SPX has a daily RSI 5 sell signal brewing, a fixed hourly RSI 14 sell signal, and the trendline setup for a reversal here looks very nice indeed. The next step if we are going to see a reversal here would be a break of the short term rising support trendline now in the 4105 area, and ideally the formation of an H&S at the possible neckline in the 4080 area.

(more…)