Slope initially began as a blog, so this is where most of the website’s content resides. Here we have tens of thousands of posts dating back over a decade. These are listed in reverse chronological order. Click on any category icon below to see posts tagged with that particular subject, or click on a word in the category cloud on the right side of the screen for more specific choices.
Wow. I have something exceptionally cool to share with you. Something so cool, it might even compel some of my thriftier readers to get a crowbar out, crack their wallet open, and become a Gold or Platinum member. Even in the midst of my zany travel schedule, I wanted to write up this post and tell you about what I managed to figure out on a delightfully rainy Sunday morning.
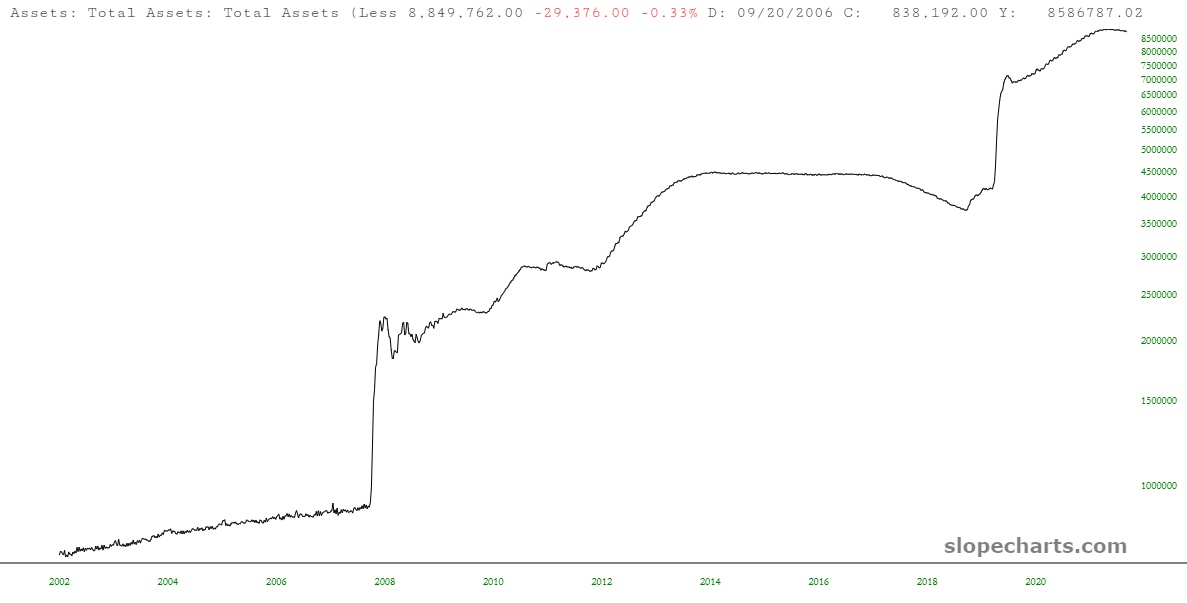
Specifically, it has to do with taking this chart……….
SPX has reached a peak of 9.57% over the 45dma on this run. That’s likely to be the highest reading as the 45dma is now rising significantly every day, and has risen 40 handles this week. We should now see a retracement that reaches at least close to the 45dma, now at 3971, and may go below it. Depending on the time taken to deliver that retracement I’d be leaning towards a target area 4000-50 as a very rough guide.
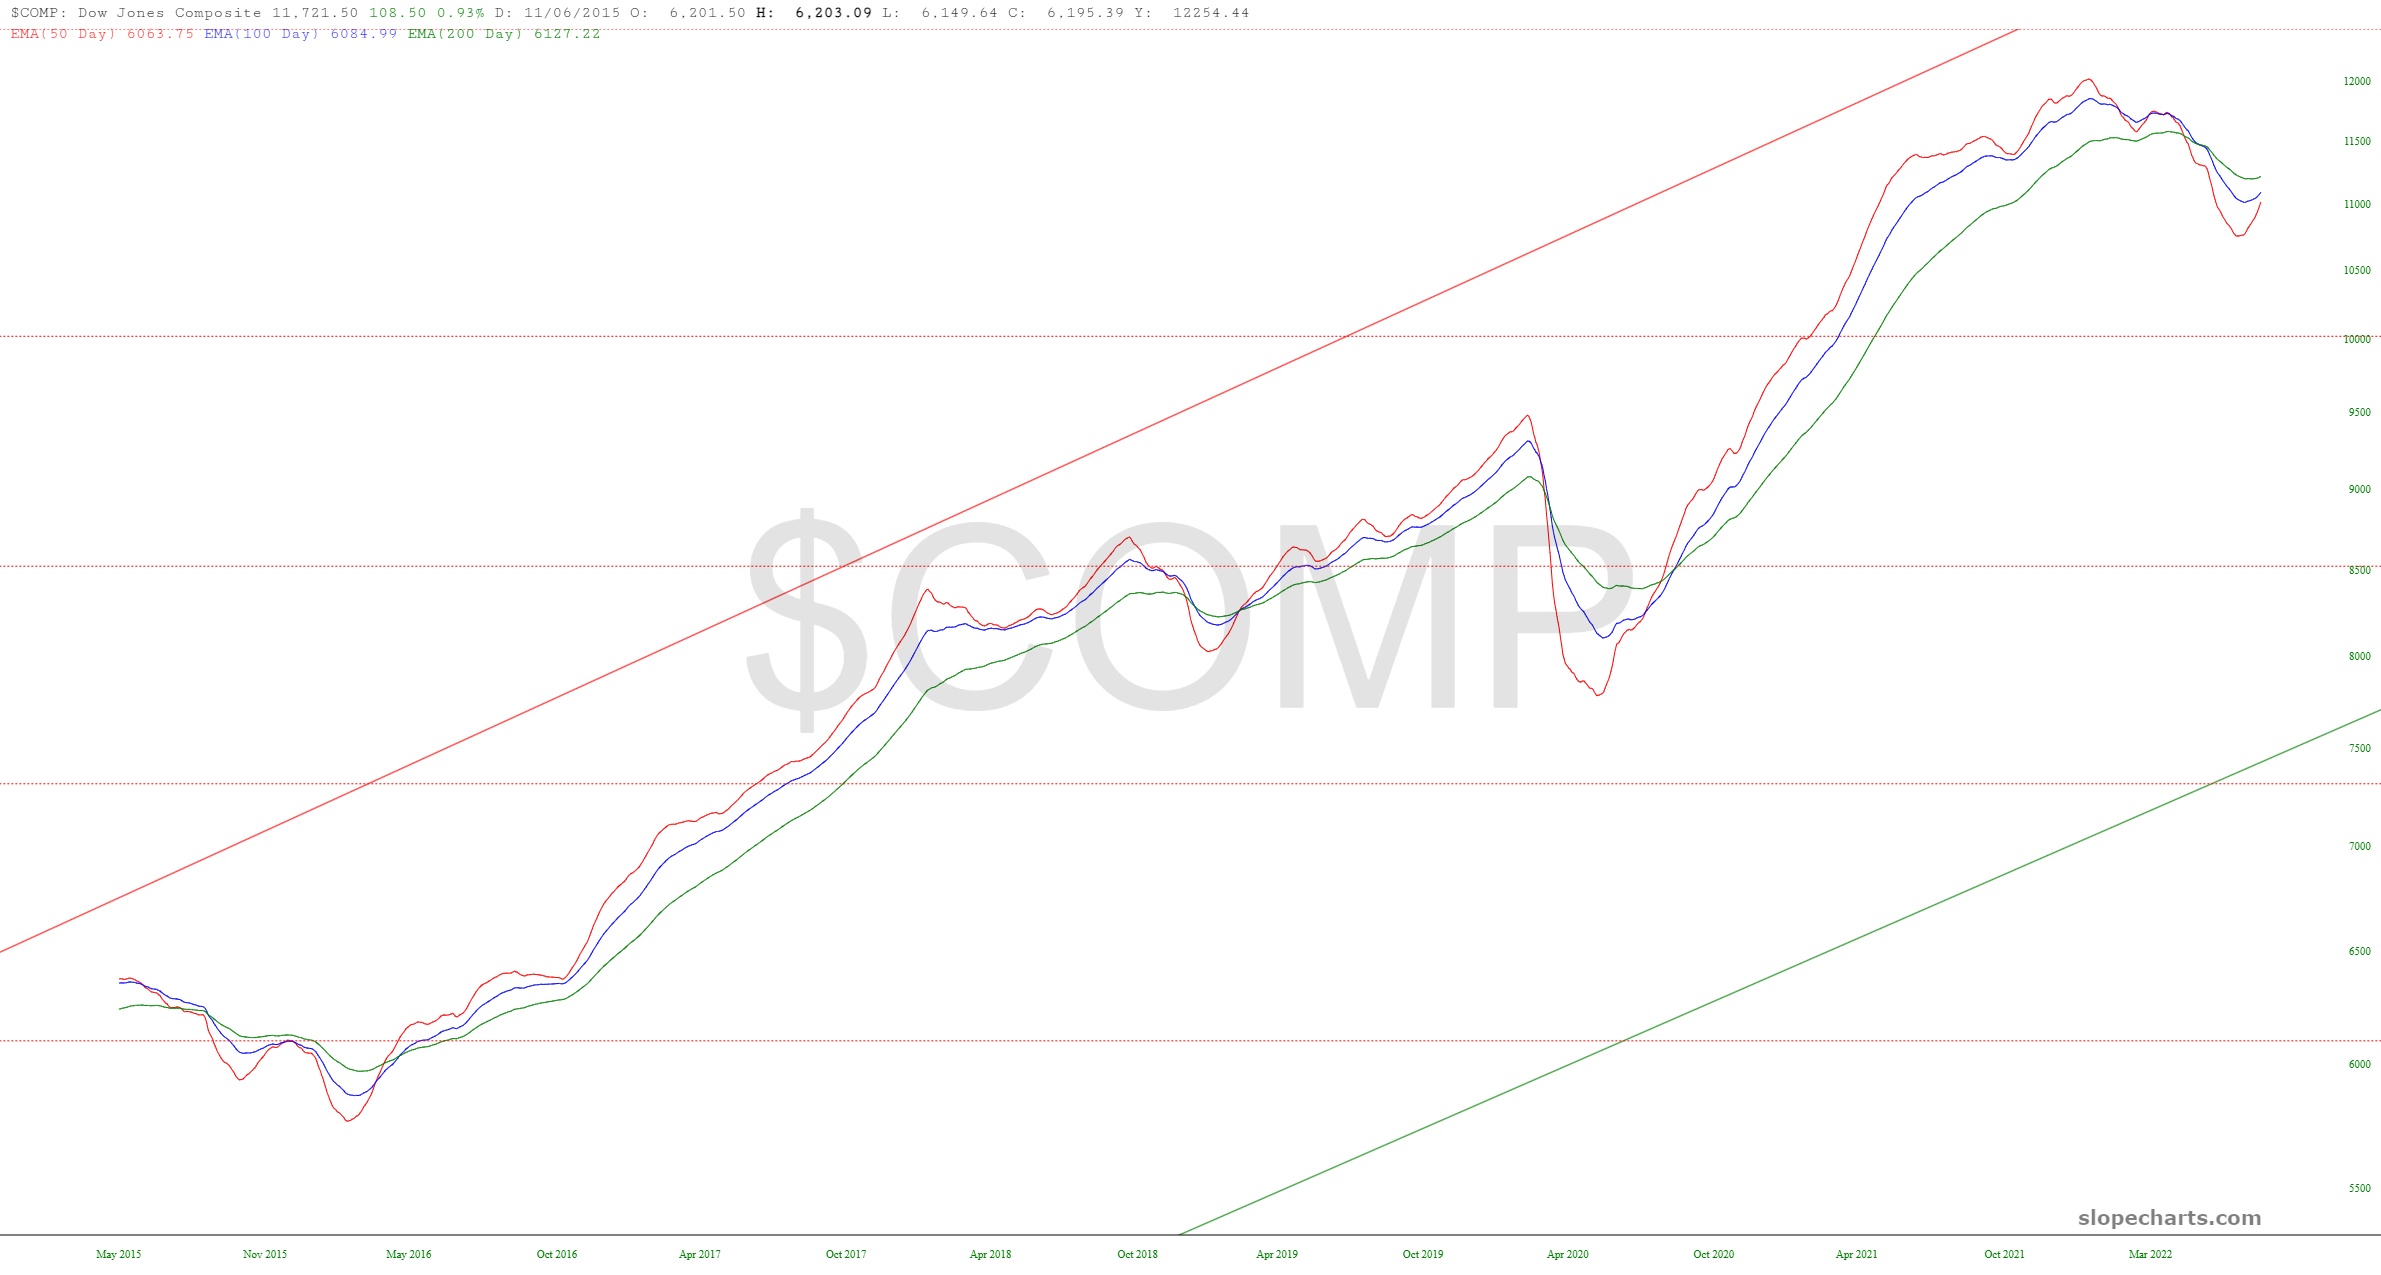
Everywhere I look, folks are talking about how the S&P is at its 200-day moving average again. I’m not sure what they’re talking about. To my eyes, it crossed over that a long time ago. I do think it is worthwhile to observe what the 50/100/200 day exponential moving averages are doing with the big indexes, however. I have deliberately hidden the price bars, since they are just noise for our purposes.
As usual, click on any chart for a big version. You’ll note there have been no bullish crossovers yet. None.
From time to time, I’ll ask Slopers what features they’d like to see on the site. For years now, always near the top of the list, was the same thing: Volume Profile.
I resisted adding this, principally because of the challenges of finding a data source. Even the most ardent volume profile fans couldn’t articulate how to get the data. But I cracked that nut, and I’m delighted to say we’ve now integrated this into SlopeCharts. In a few days, this will be limited strictly to my beloved Gold and Platinum users, but for this initial rollout, I’m letting everyone try it so I can get feedback.
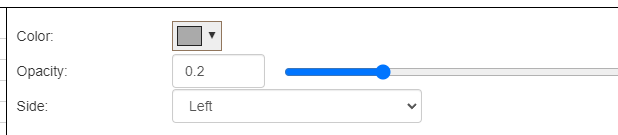
Volume Profile is accessed via the same Technical Indicators dialog box where all the other studies live. You have several controls: the ability to change the color of the volume profile, the opacity, and whether or not the profile is anchored to the left or right side of the screen.
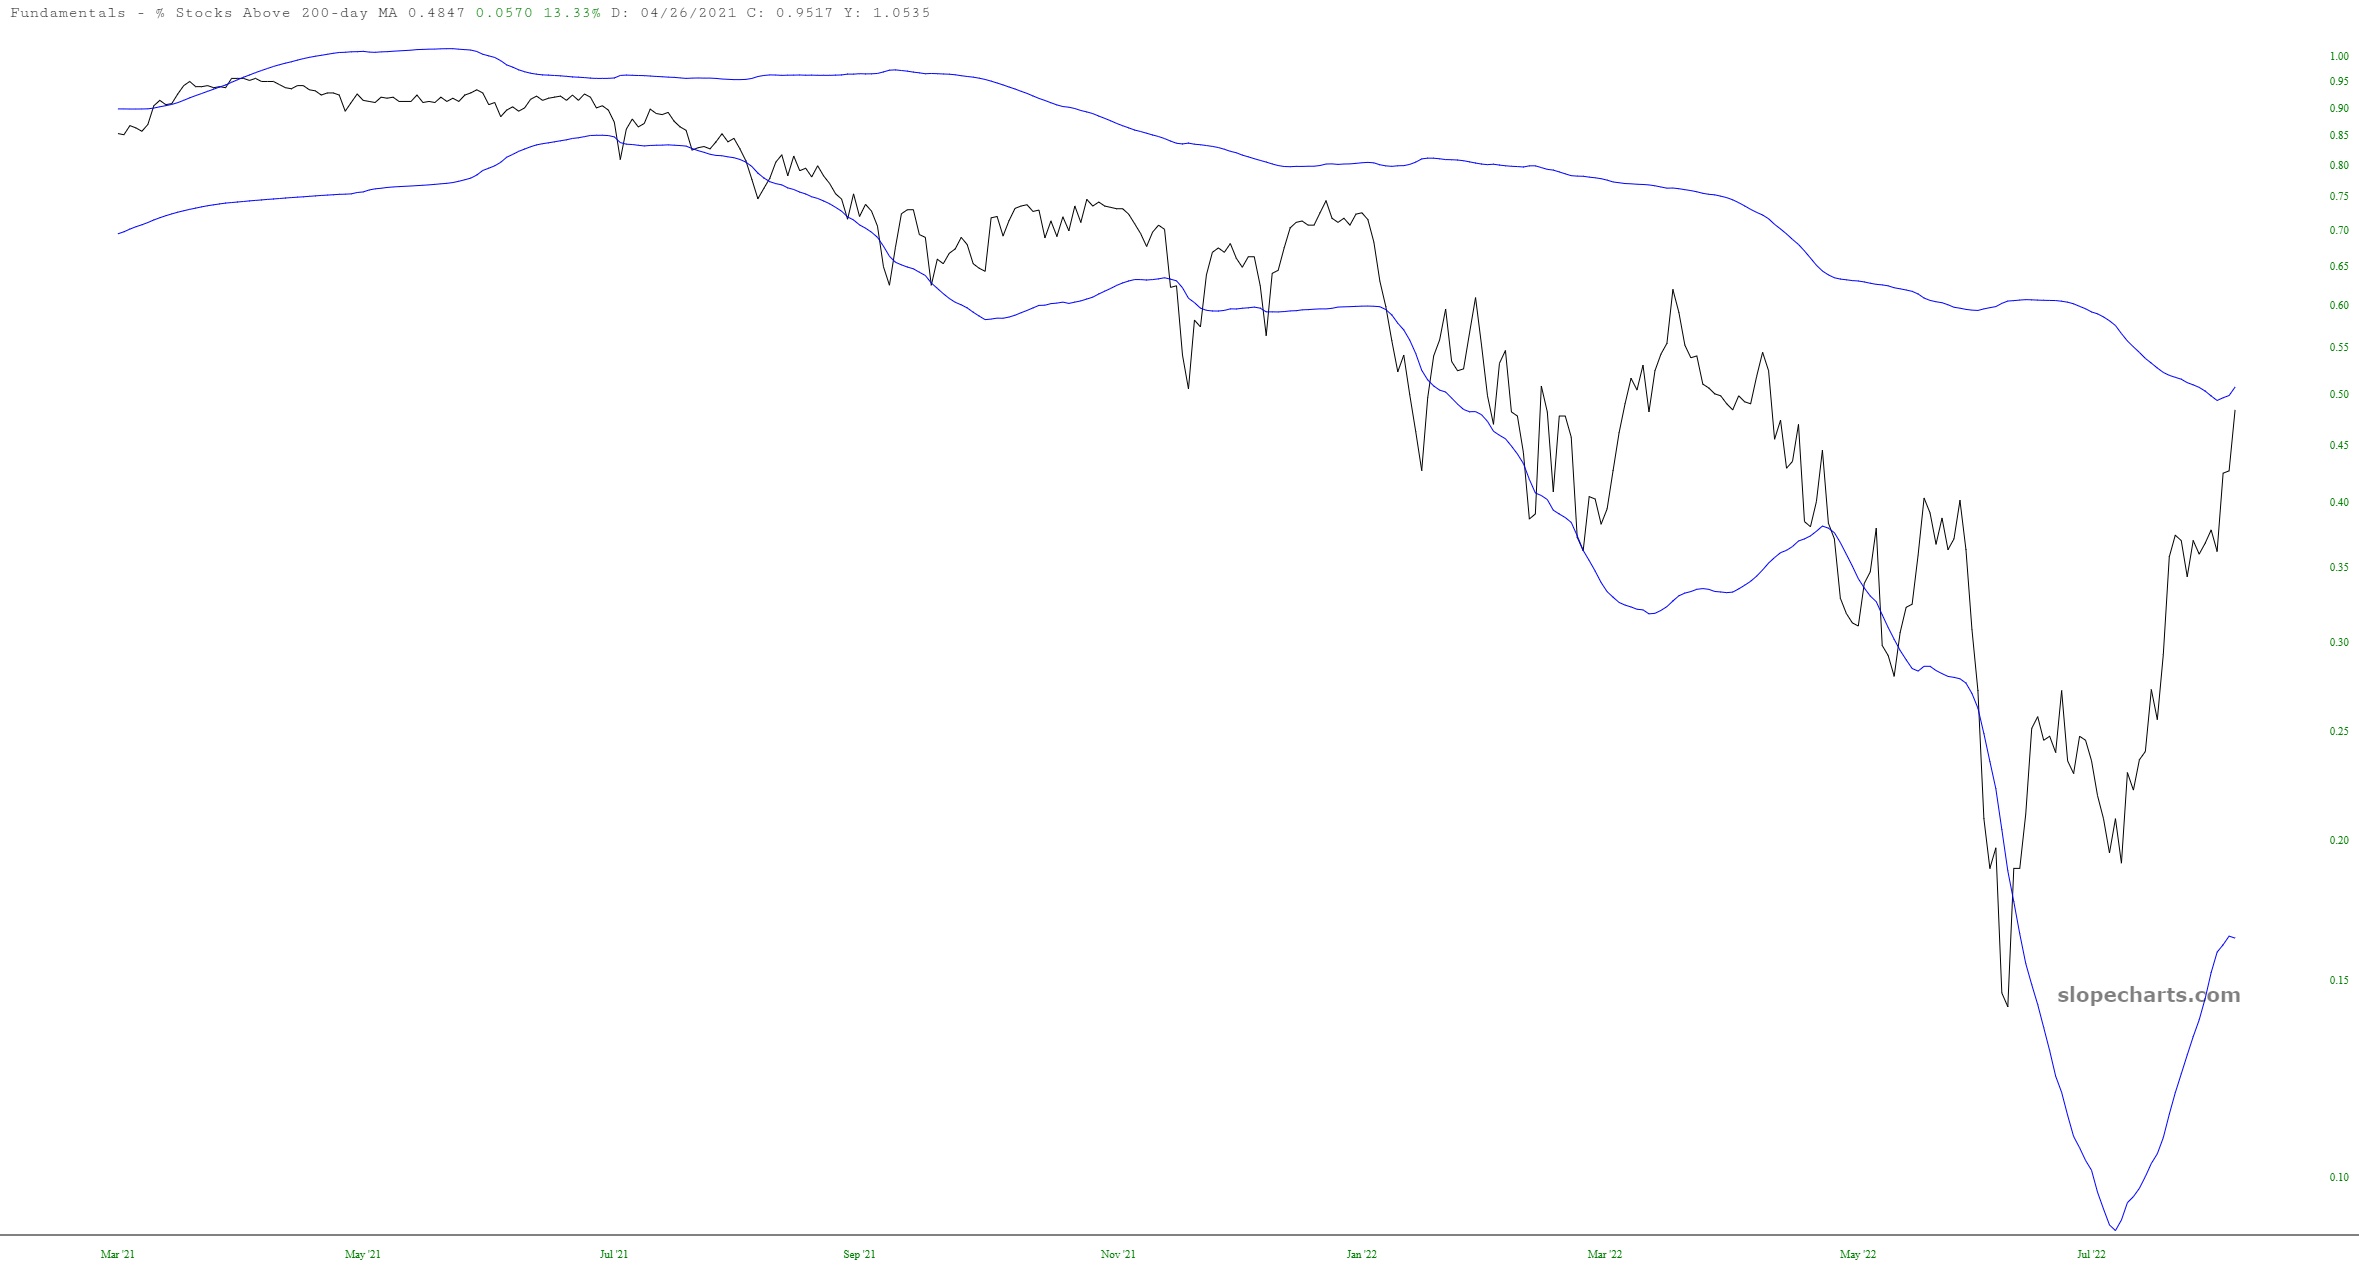
Here’s something I’ve never tried. Below is a very simple chart made up of two line graphs. The black line chart shows the percentage of stocks that are above their 200-day moving average. For obviously reasons, it has made a “lower high” recently. The blue lines are slow-moving Bollinger bands. I think this succinctly illustrates how crazy-overbought we are.