I’m not going to post the ES chart today, as not much has changed since yesterday morning and I’m short on time. ES is trading around the 50 hour MA (currently at 1825), which is saying that the retracement may be ending or ended. Bulls need to break back over 1833 ES confirm that the retracement is over and trigger a double-bottom target targeting new highs. (more…)
Slope of Hope Blog Posts
Slope initially began as a blog, so this is where most of the website’s content resides. Here we have tens of thousands of posts dating back over a decade. These are listed in reverse chronological order. Click on any category icon below to see posts tagged with that particular subject, or click on a word in the category cloud on the right side of the screen for more specific choices.
In with the New
Happy New Year everyone! I hope everyone had a good holiday.
I was looking for signs of a short term high last week and I’m now seeing some. There is very marked negative divergence on the SPX 60min RSI and I have the current highs at a possible rising wedge resistance trendline from the October low at 1646. The obvious target for any retracement from here would be rising support from that low, now in the 1790 area and rising at about ten points per week. We may see a retest of the current highs today, and I’m still looking for for a larger topping pattern here than the obvious short term double top targeting the 1835 area on a break below 1842 today. SPX 60min chart: (more…)
Bonds Continue the Slide
As I’ve said ad nauseum, interest rates accelerating higher could be the defining theme of 2014. Since bottoming in July 2012, the ten-year T-note rate represented by symbol $TNX has more than doubled. Freakishly, real estate seems to be merrily hopping along, as if 2008 never happened. I can report to you from my pleasant town that I wish I had some way to buy puts on Palo Alto real estate, because it’s insane (again). In any event, the bonds, represented by symbol TLT below, continue to crumble away, and I remain short. (more…)
Interest Rates Will Define 2014
As the world warms themselves around the comforting glow of TWTR, FB, GOOG, and all the other red-hot stocks of 2013, I’d like to quietly point out that interest rates are creeping up almost imperceptibly toward an important breakout level.
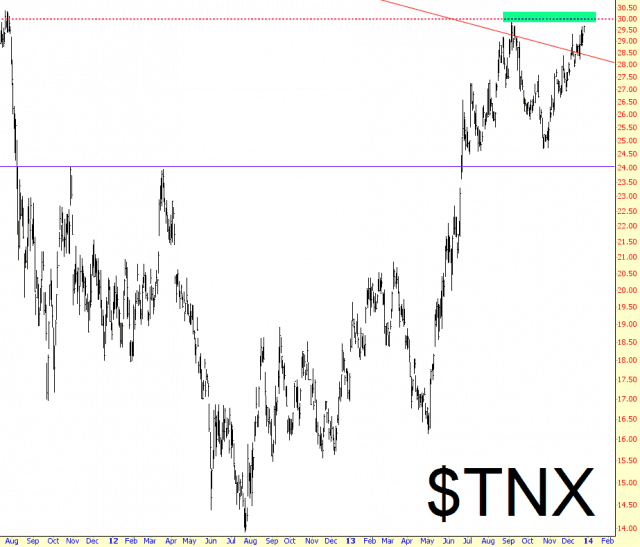
Central bankers have had the freedom to do what they’ve been doing based on a very accommodating interest rate environment. If inflation starts to really kick in, well, game over, man. I’ll be watching the chart above closely, as I think its movement could be a driving force behind 2014.
Joseph and the Innkeeper
SPX followed the daily upper bollinger band upwards yesterday, and using my usual practice of counting any close within two points as a close on the band, closed on the band. The band isn’t rising at full speed yet as the 20 DMA is still turning up, but I’m expecting the upper band to close today in the 1830-2 range, and most likely the SPX close today will be within two points of that. SPX daily chart: (more…)
