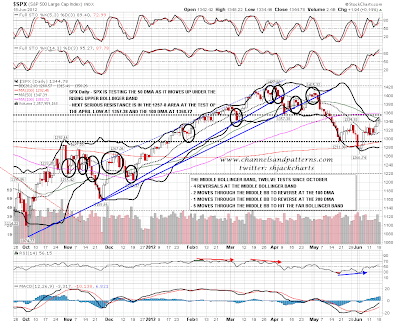
I was asked yesterday whether we might see a gap and go day, and I replied that the chances of seeing a very strong up day here look limited, with SPX testing the upper bollinger band and in some need of retracement. That’s still true today though somewhat less so. Until we see a break with real confidence over the 100 DMA at 1359.5, this remains an obvious area to see some retracement or at least consolidation:
NYMO has hit some very overbought levels this week and I was looking at this as a reversal signal since the start of 2009. At best this looks mixed. This level on NYMO has been hit five times previously in a downtrend or during the bottoming process, and it was a reasonable reversal signal then, albeit the hit of the 75 level did not usually mark the high, which followed higher and a few days later. There were three hits during an uptrend and these then signaled at best minor retracements. A higher high with negative divergence on NYMO is a better signal historically:

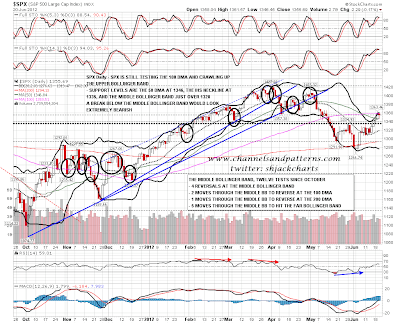
There are a lot of bloggers looking for a rally high here and I don’t see that as likely. Taking short positions with an IHS setup like the current one has very grim results historically. That said it’s still possible of course, and as none of the previous five successful reversal IHSes since the start of 2009 has seen a neckline retest that went more than ten points below the IHS neckline, I would put a line in the sand there at 1325. That fits well with the middle bollinger band on the daily chart just over 1320:

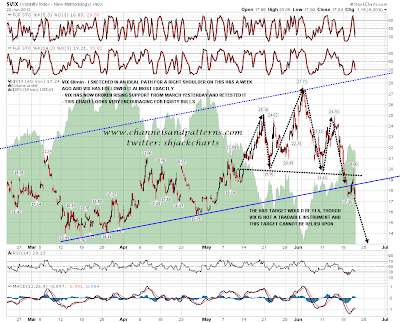
Looking at the Vix action yesterday, it closed lower, so the Vix Sell (equities) Signal did not confirm. Vix retested the H&S neckline and closed back below both the neckline and broken channel support, which still looks bullish for equities:
TLT broke below rising support from April briefly yesterday but is still holding the very important 124-5 support range. A break below there would look very bearish for bonds and bullish for equities. There is a decent declining resistance trendline from the highs at 126.5 today and a close above would look bullish for bonds:

Looking at Dr Copper today, it is unimpressed with this rally on equities so far and the giant H&S pattern that I’ve been posting periodically there is still forming. This looks weak and to the extent that this is an indicator for equities it still looks bearish. A rally to 1400 or so on SPX however would not change this picture on the weekly chart significantly so that’s not immediately bearish:

Oil is also positively correlated with equities and also looks depressed here, with a huge potential double top that would trigger on a break below 75. Again, that’s not immediately bearish though:

Overall I’m still leaning towards this being a strong rally rather than a new impulse up from a major low, and it has to be said that we are now testing the area that I identified as the key resistance level to watch a couple of weeks ago. The pattern setup here indicates higher however, and even if this is just a rally there is no real reason to think that SPX could not test 1400 within that. I’d like to see a decent support trendline established with a retracement or consolidation here, and I have rising support currently on SPX in the 1340 area, the IHS neckline retest in the 1335 area, and the middle bollinger band slightly under 1325. Until we see a move below 1325 I’ll be viewing this rally as ongoing. If we see a close over 1370 then resistance at the SPX 100 DMA may well become support.