On the FOMC stats I was looking at last week, of the four similar instances since the start of 2010, and of the three of those that topped in the next few days, one topped on the Monday afterwards, and the other two topped on the Tuesday. If we are to see that intraday high today my target range is in the 1965-70 area and that would respect resistance on the primary rising channel on my weekly chart below. SPX weekly chart: (more…)
Slope of Hope Blog Posts
Slope initially began as a blog, so this is where most of the website’s content resides. Here we have tens of thousands of posts dating back over a decade. These are listed in reverse chronological order. Click on any category icon below to see posts tagged with that particular subject, or click on a word in the category cloud on the right side of the screen for more specific choices.
Can’t Get The Help
Having lost new data a few days ago, stockcharts appears to been down altogether this morning. Hopefully this isn’t becoming a regular thing. I’ve managed to locate enough charts for the post this morning as I tend to post quite a few charts during the day, and I have picked three that I posted yesterday for this morning.
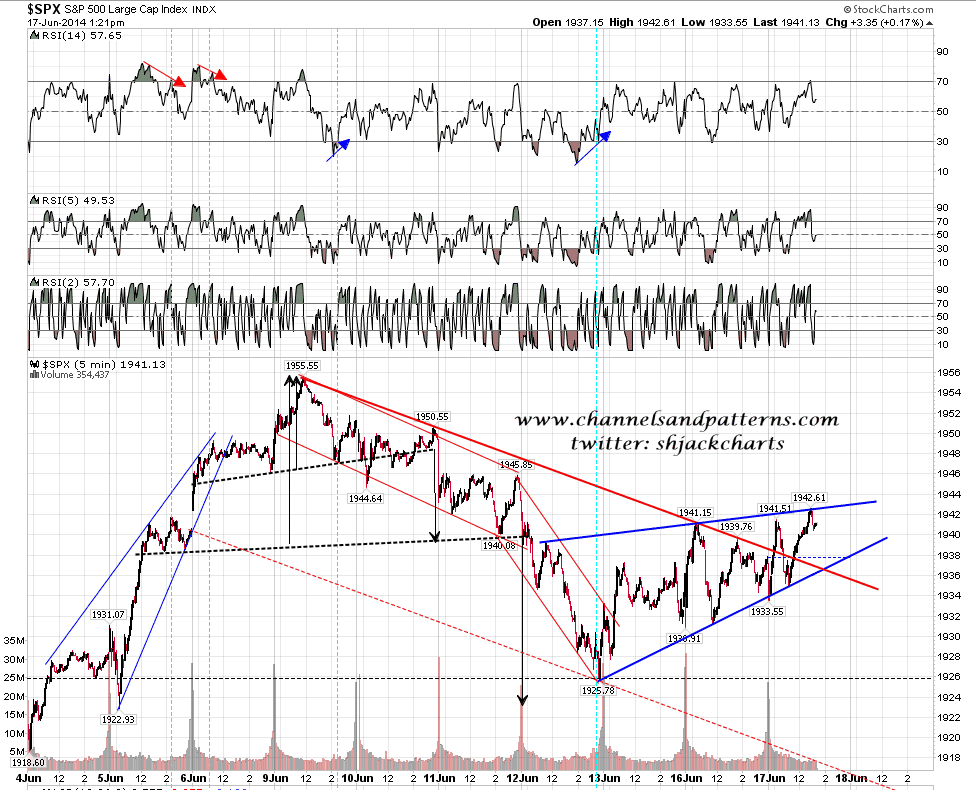
The first chart I posted on twitter yesterday afternoon, and it shows the rising wedge on the SPX 5min chart. This overthrew twice before the close and although this is a 70% bearish pattern targeting a retest of the lows on a break down, it may be that this one is going to take the 30% odds route and break up with a target in the 1960-5 area. SPX 5min chart (Tuesday PM):
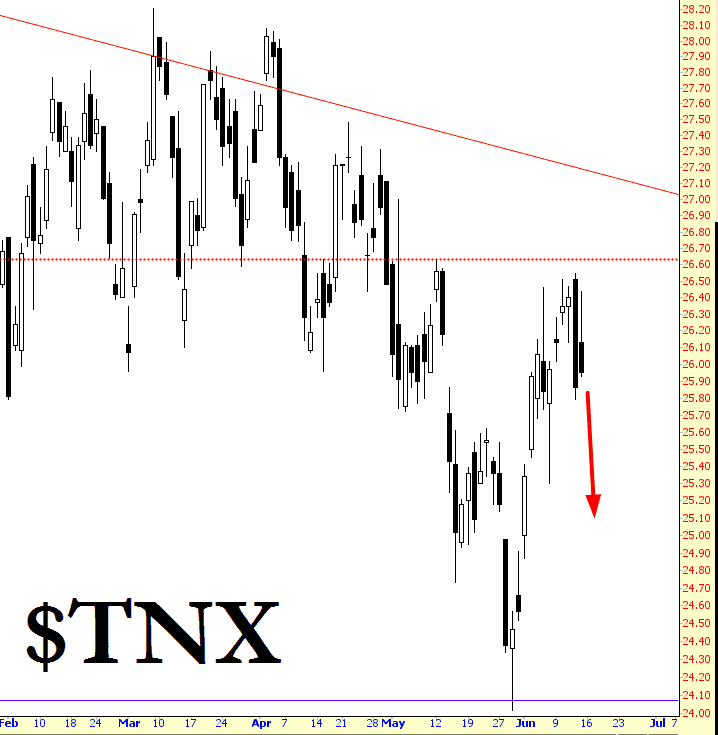
Looking at Bond Yields
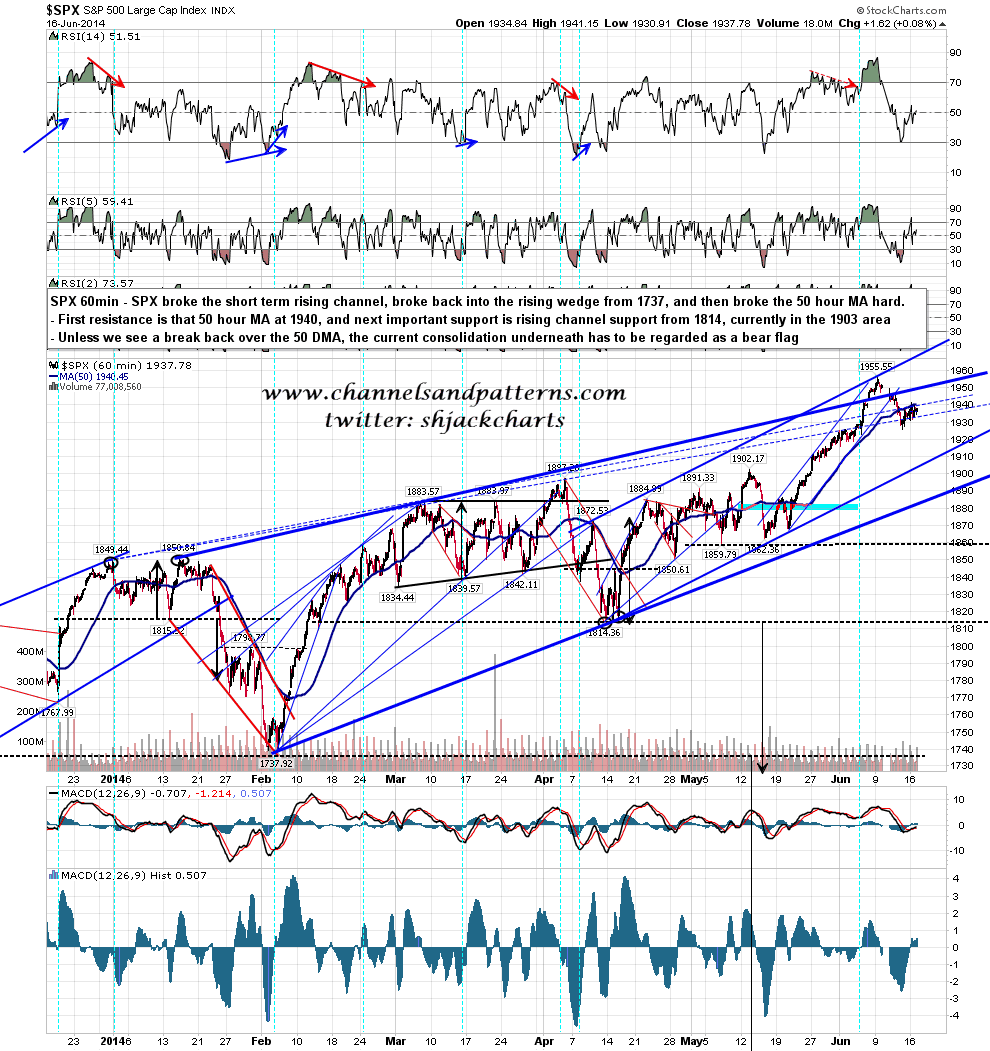
Yesterday was another day just chopping around while we wait for this consolidation to finish. We have been seeing higher highs and lows, which seems bullish until you remember that a typical bear flag forms against the trend, and trends sideways to up. Both SPX and NDX have been doing that under their respective 50 hour MAs and until the break back up over those my working assumption is that we have been watching bear flags forming.There is a decent chance that we will see a break either way today from this consolidation. SPX 60min chart:
The Daily Middle Band
Friday was more bullish than I expected but resistance at 1937 held on repeated tests and if we are to see an opening gap today, then it seems likely at the time of writing that it will be a gap down. The SPX 50 hour MA is now at 1939 and is still primary resistance. In the event that is broken then main rising wedge resistance is in the 1947 area. I’m expecting more downside today however.
I think this retracement may develop into something substantial if the bears can develop some momentum, and we’ll see whether they can. At minimum though I’m looking for a test of the SPX daily middle bollinger band, which closed yesterday at 1918, and that target could be hit today. This is a target that is often pinocchioed intra-day, so it’s important not to read too much into a break below it unless that persists into the close. SPX daily chart: (more…)
Watching With Interest. Heh.
I remain cheerfully long bonds via TLT. Rates, I believe, are going to keep sinking.