I am very pleased to let you know about a couple of improvements in SlopeCharts.
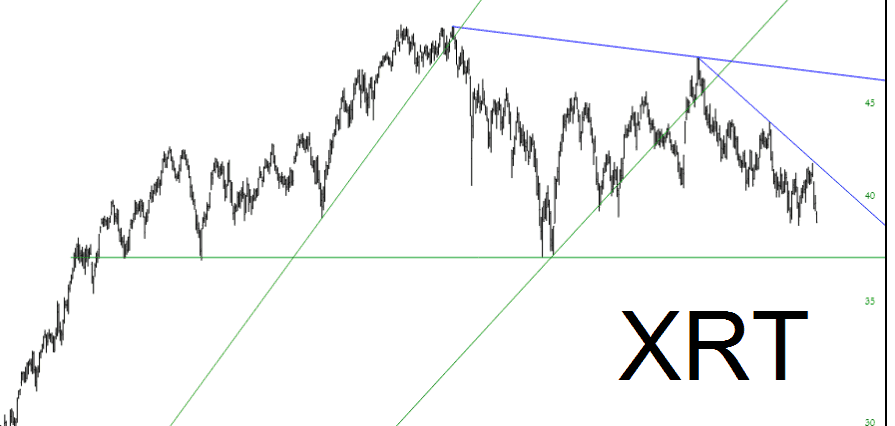
First of all, there is a new element on the data line which shows the Y-axis value of wherever it is you are pointing on the screen. This can be useful if you are projecting a target on a chart (or for whatever reason). The x-axis is already there (since it’s a date), but now you can pinpoint the Y-axis with your mouse just by observing the value on the data line.
![]()
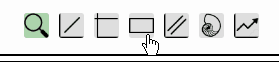
The other improvement is an enhancing to the existing Rectangle tool. As a reminder, to emphasize a specific part of a chart, you can use the rectangle highlight tool. Select it from the toolbar at the top of SlopeCharts: