I have been pretty vocal about these targets, and we are getting very close to nailing them; today could be the day for a (probably temporary!) bottom to the bond drop.
Slope of Hope Blog Posts
Slope initially began as a blog, so this is where most of the website’s content resides. Here we have tens of thousands of posts dating back over a decade. These are listed in reverse chronological order. Click on any category icon below to see posts tagged with that particular subject, or click on a word in the category cloud on the right side of the screen for more specific choices.
Have We Begun the Final Rally? (by Avi Gilburt)
On Tuesday night, I said we needed to maintain support over the 1394ES level in order to still view the upside as a reasonable possibility. On Wednesday we rallied off the overnight lows that held support over 1394. But the move up was an ugly pattern which seems to be best counted in waves of 3, so that we do not have to force an even more ugly count. This leads me to the conclusion that it is a possible leading diagonal. And, I have mentioned many times in the past how much I like to rely upon leading diagonals for trading purposes, but this is what the market has been giving us for 1st waves all too often.
Therefore, IF this is a leading diagonal, then either wave 2 has already completed in a very shallow manner, or we will see a much deeper wave 2, which is more typical of leading diagonals. But, if you remember the larger wave count I posted on the 60 minute chart today, the expectation was that wave 1 of wave iii was going to target the .618 extension at the 1406ES level, which is exactly what we seem to have gotten today. Therefore, based upon how we move up tomorrow, assuming we do see upside follow through, we will be targeting the 1412(1.00 extension) or 1416 (1.236 extension) levels for wave 3 of iii.
TLT Breaks Major Support (by Springheel Jack)
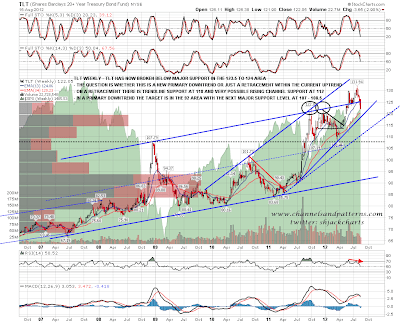
Somewhat to my surprise TLT gapped down through major support at 123.5 to 124 yesterday, and almost made it to the sloping H&S target in the 121 area. Realistically I am expecting more downside on TLT after this break, though we might first see broken support retested and possibly yesterday morning's gap filled first. There is an OK looking double-top indicating to the 116.5 to 117 area, but the quality isn't great and I'd prefer to consider the trendline setup as I think it is more likely to deliver the correct target.
First trendline support is decent and is in the 118 to 118.5 area. This is my minimum target unless we see a strong and fast recovery over broken support, with it held afterwards. On a break below 118 to 118.5 I have possible rising channel support in the 110 – 112 area. On a break below that support trendline TLT should be in a primary downtrend, with the obvious target in the 92 area. However the next major support level is in the 107 to 108.5 area and that is particularly important as that support level is a possible H&S neckline for an H&S that would target the 84 area, subject to exactly how that formed. Any further downside on TLT will tend to support equities while it lasts, though the correlation isn't tight:
In Praise of Slope Contributors
Before trundling off to my nighttime reading, I just wanted to say thank you to all the folks who regularly contribute to Slope as guest writers. Off the top of my head, these include Springheel Jack (our early morning companion from across the pond), Strawberry Blonde, Ryan Mallory, TNRevolution, Gary Tanashian, BBFinance, BDI, Mark St.Cyr………and I'm sorry for not remembering more, but it's late.
These folks do Slope a world of good. Their contributions bring more variety to the blog; they keep the place more content-rich; they give us all good ideas and new insights; and, from my selfish point of view, they give me breathing room to see my family now and then.
I am genuinely, truly grateful to everyone who contributes – – and if you've been wanting to write for Slope, feel free to drop me a line. The payment will be as awesome as everyone else receives (specifically, the gratitude of Slopers, including myself). Long story short – – I deeply and genuinely appreciate what the other authors on this blog contribute.
The “Rush to Crush” Volatility
The two Weekly ratio charts below depict the SPX vs VIX and the RUT vs RVX.
Very simply, you can see that each rally made by these two Indices since the lows of three years ago has produced an increasingly steep advance before it pulled back. The current rally from the June lows of this year is almost starting to exhibit a "parabolic" steepness to it. It may run for awhile yet before potentially plunging. However, volumes these past couple of weeks has been very low, and whether this is a precursor to a change in trend remains to be seen.
Price on both charts has reached the top of a channel. The current rally may have run out of steam, and we may see price either pull back or consolidate at the highs to produce more of the same kind of roller coaster intraday activity that we've seen recently. Alternatively, we could see an acceleration of the rally to an even greater parabolic steepness, but I would expect that higher volumes would have to enter these markets to produce this kind of scenario. Near-term support levels are 95.00 on the SPX:VIX and 40.00 on the RUT:RVX.
These are important ones to watch over the coming days/weeks, particularly in the run-up to the Jackson Hole Symposium from August 30th to September 1st, and the FOMC Meeting results and Fed Chairman's press conference on September 13th (as well as the Eurogroup Meetings on September 15th and the European Council Finance Ministers Meeting on September 16th).


