
Looking at the polls this morning an Obama victory looks more likely than not. I don't have much time for Obama, as in my view he's just been a stuffed shirt and empty head sitting behind a desk that a president of genuine force and vision, like either Hillary Clinton or John McCain, could have been occupying to much greater effect. All one can say for him really is that he looks good compared to his predecessor, who was really an unmitigated economic and fiscal disaster. That said Obama is on the verge of his first genuinely impressive achievement in office, which is being re-elected with a track record that would have sunk most re-election campaigns. If he is re-elected tomorrow this may of course also be his last impressive achievement in office.
What would an Obama victory mean for the markets? Well it will leave Ben Bernanke still firmly in the saddle centrally planning/directing the US economy, and as Ben Bernanke has so far been a one-trick pony in terms of policy, that means that we can look forward to four more years of money printing and ZIRP in an effort to bring back the gold old days of the Fed-led speculative bubbles in 1995-2000 and 2003-7. That has been good for equity markets in the past and may well still be good for a while yet. There is a serious question mark though over current policies of massive deficit spending. Even if the fiscal cliff is delayed well into 2013 it's hard to see an agreement to continue running huge deficits indefinitely emerging unless the Democrats win big in both houses of Congress. If the republicans have an effective veto over this then some significant government retrenchment seems likely. That will be a big economic wild card in 2013/4 whoever wins this election.
In the short term the bear flag on ES yesterday morning didn't play out, and ES has struggled over the first strong resistance level at 1410 that I mentioned yesterday morning, and has been testing the second at 1416.5. Short term support is now at 1410 and in the event that we see a decent break over 1416.5 the next target will be a test of the strong resistance level at 1432 that ES failed at on Friday. ES is currently making short term higher highs and lows which is cautiously bullish:

There is a similar setup on NQ which has also been making short term higher highs and lows. If NQ can break over declining resistance then, as with ES, there is very strong resistance overhead in the 2695 area. A break over that with any confidence would look very bullish. A failure to break over it will suggest either continuation lower or at least a retest of the current lows:
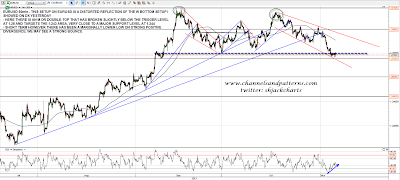
As a bellwether for NDX/NQ particularly AAPL is bouncing so far at the declining channel support that I posted on Sunday. That's still ambiguous as a key target for AAPL is the strong support level and possible H&S neckline in the 565 area just below. AAPL could test that within the channel tomorrow or Thursday before a very possible bounce there that would then most likely break that declining channel to peak in the 605-25 area (bear H&S option) or make a major low there to start a new bull run (bull option). If we do see the 565 area tested on AAPL this week before a major bounce, that will be a very nice setup for a strong bounce from there:

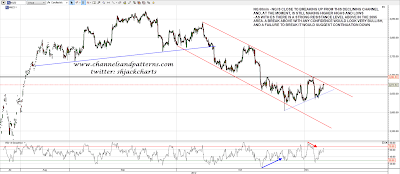
I showed the double-bottom setup on DX yesterday morning and today I'll show the distorted reflection of that on EURUSD. EURUSD has broken below the trigger level for this pattern, which has a target close to a major support level in the 1.244 area. Short term however EURUSD has made a marginal lower low on positive RSI divergence and we could see a bounce here:
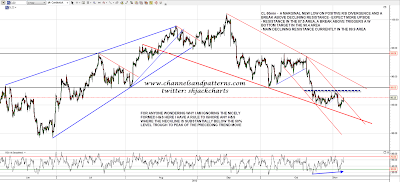
As with EURUSD CL has made a marginal lower low on positive RSI divergence. The setup is stronger on CL however as it has also broken short term declining resistance and formed a decent looking potential double-bottom. Key resistance is in the 87.5 area and a break over that opens up a run at the main declining resistance trendline currently just under 90. A break over 90 would open up a lot of potential upside and CL is an interesting looking long here:
My last chart today is a very thought-provoking chart sent to me yesterday by Chart of the Day's free daily email service. You can see how closely SPX has followed the average election year cycle so far in 2012 and from here there would normally be a rally into the end of the year. That may not happen but it's certainly interesting and it may well happen if we don't see a major support break on SPX soon. You can see their full post on this chart by clicking on it below:

Short term the important resistance levels on ES are at 1416.5 and 1432 and I'm leaning towards another test of 1432. Support on ES is now at 1410 and the last low at 1402.5. A break below 1402.5 would establish short term lower lows and highs and would open up a test of the current retracement low on ES at 1393, and the very strong support level just below at 1388.
