
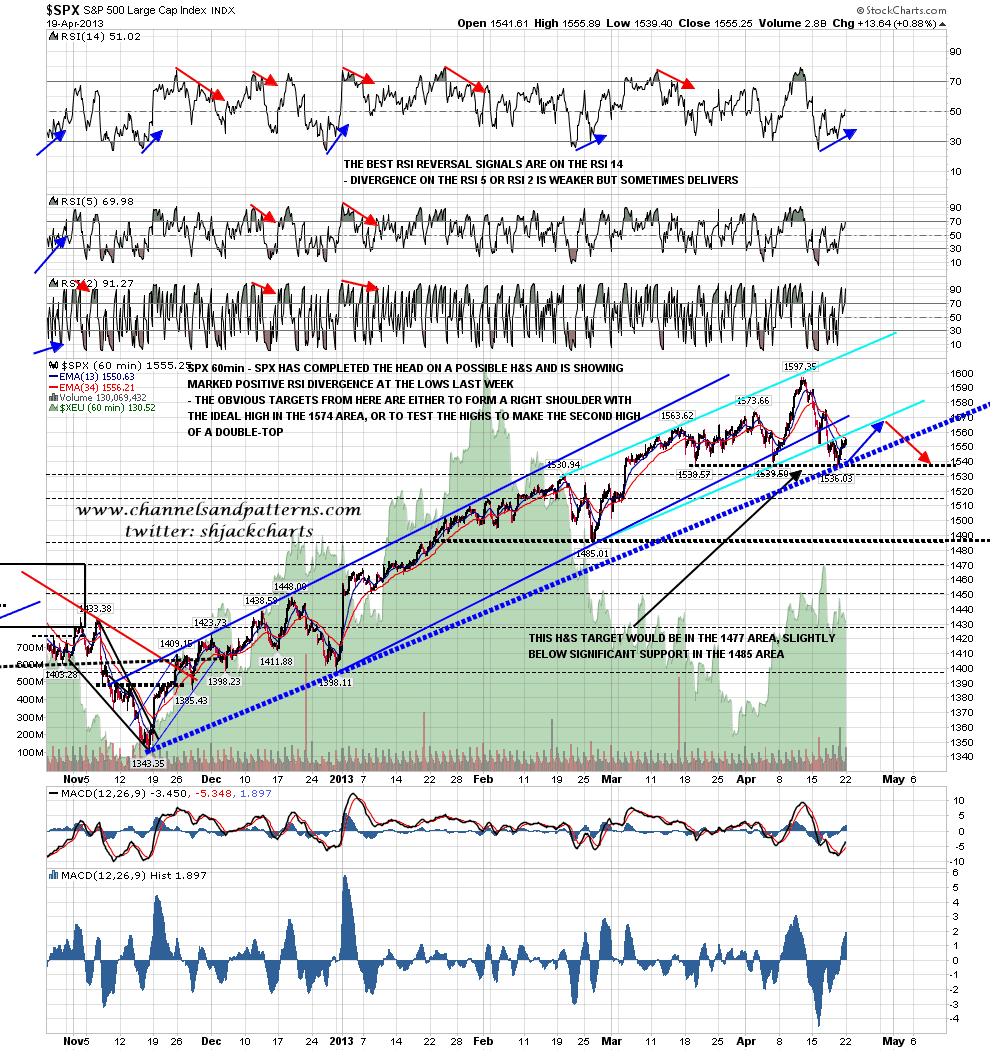
There was a cliffhanger close on Friday, with ES having tested but not broken over declining resistance from the high. Overnight ES has broken over that and I am expecting to see some follow through to the upside. as I mentioned on Friday Morning, this could be viewed as a falling wedge and in that case the technical target is a test of the highs, but wedges aren’t good at making the full target, and there is strong resistance in the 1570/1 area:

Now that we have seen this break up on ES I will run through what I am seeing as an attractive scenario for what happens over the next few weeks as we see the usual strong retracement from the usual spring high. On SPX, as I have mentioned before, these highs generally take the form of an H&S or a double-top. I’m leaning towards an H&S at the moment, and as I was mentioning last week, the ideal right shoulder high would be in the 1574 area. The downside target for either an H&S or a double-top would be in the 1477 area:
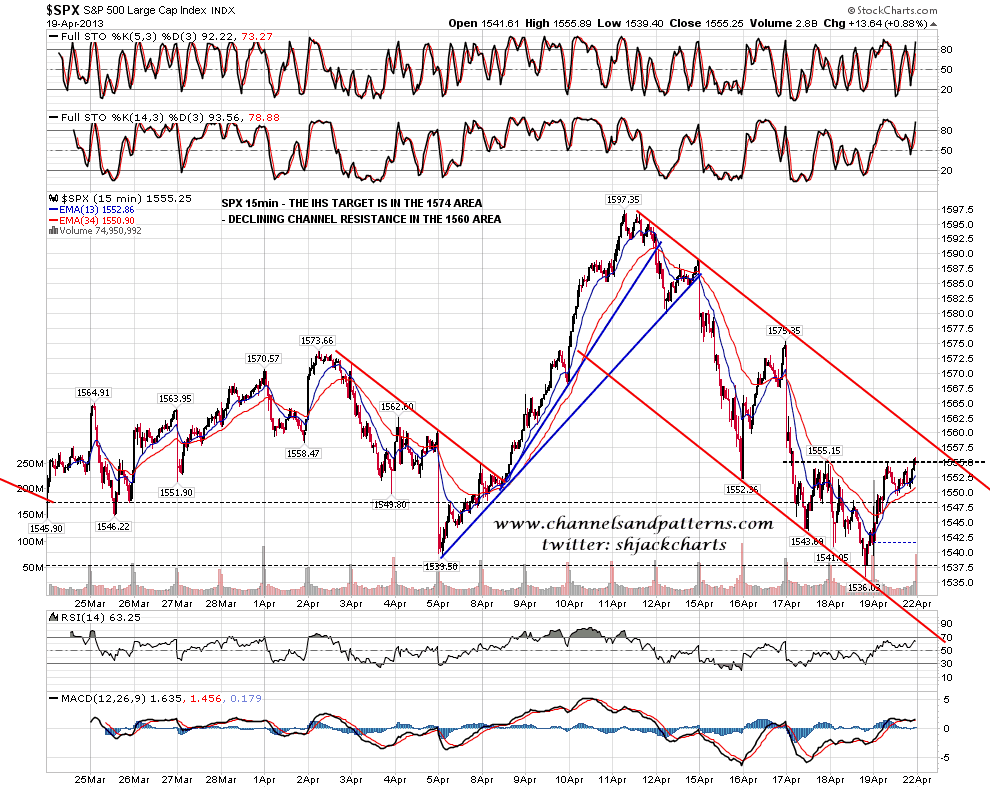
One reason that I’m favoring the H&S scenario here is that there is also a clear short term IHS on the SPX 15min chart, and the target for that is in the 1574 area, at the ideal height for a right shoulder high. Declining channel resistance in the 1560 is resistance on the way there:
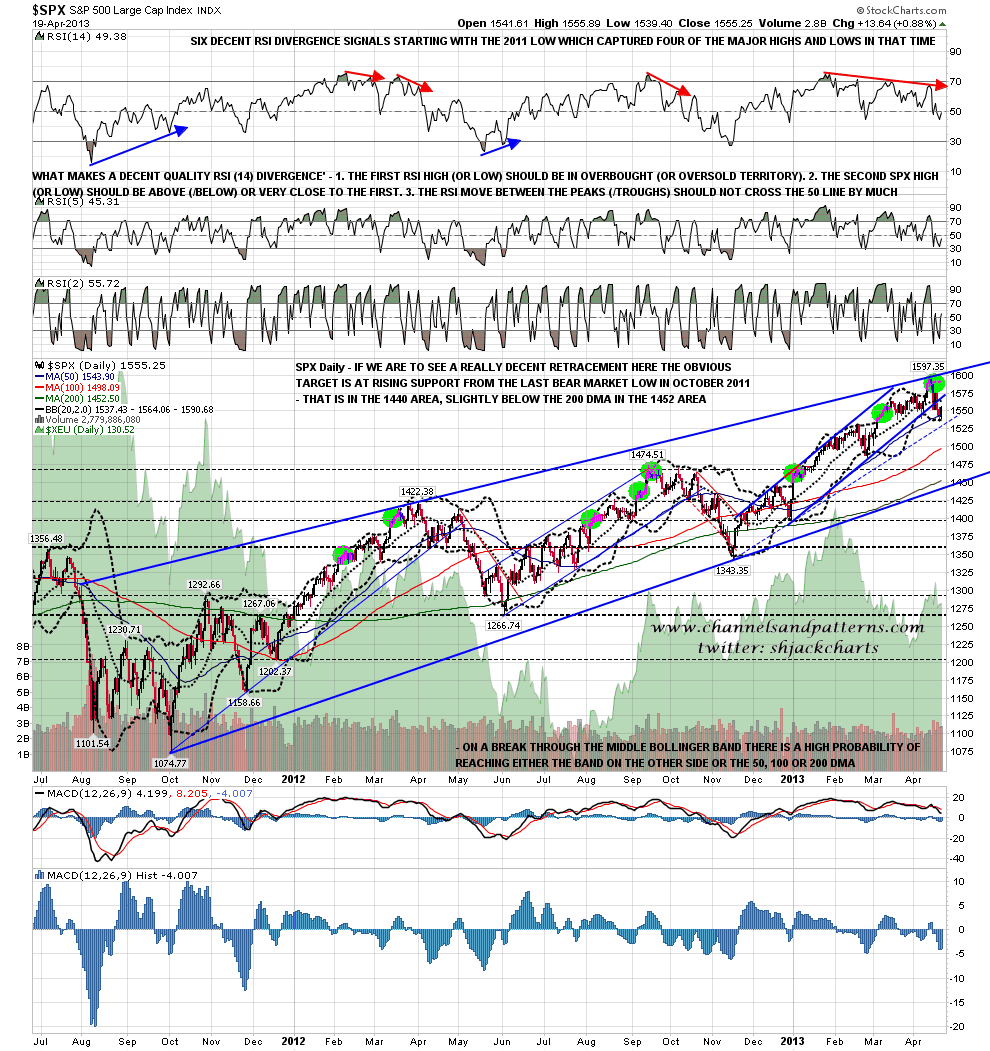
If this scenario plays out then the H&S or double-top target would be in the 1477 area, which would then have me looking at two levels near 1450 as the ideal retracement low area. The higher of those levels is the important 200 DMA, now at 1452. The lower of those is rising support from the October 2011 bear market low, and if we see a test of that trendline then we may well be looking at a part-formed rising wedge for this cyclical bull market, which would give us a decent upside target range for the next move up after the retracement:
Will we see this play out over the next few weeks? There’s only one way to find that out for sure and that’s to wait and see, but it hangs together well over multiple timeframes and I like it as a scenario.
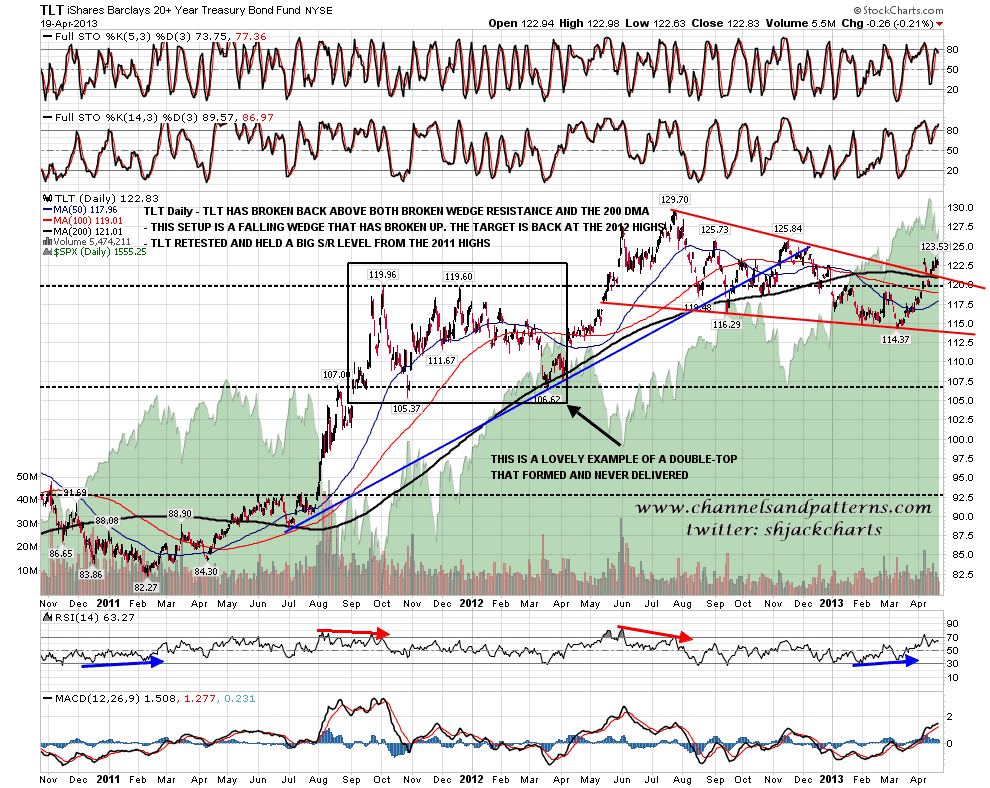
On other markets TLT is testing the recent highs. The overall setup here strongly suggests a test of the 2012 highs:
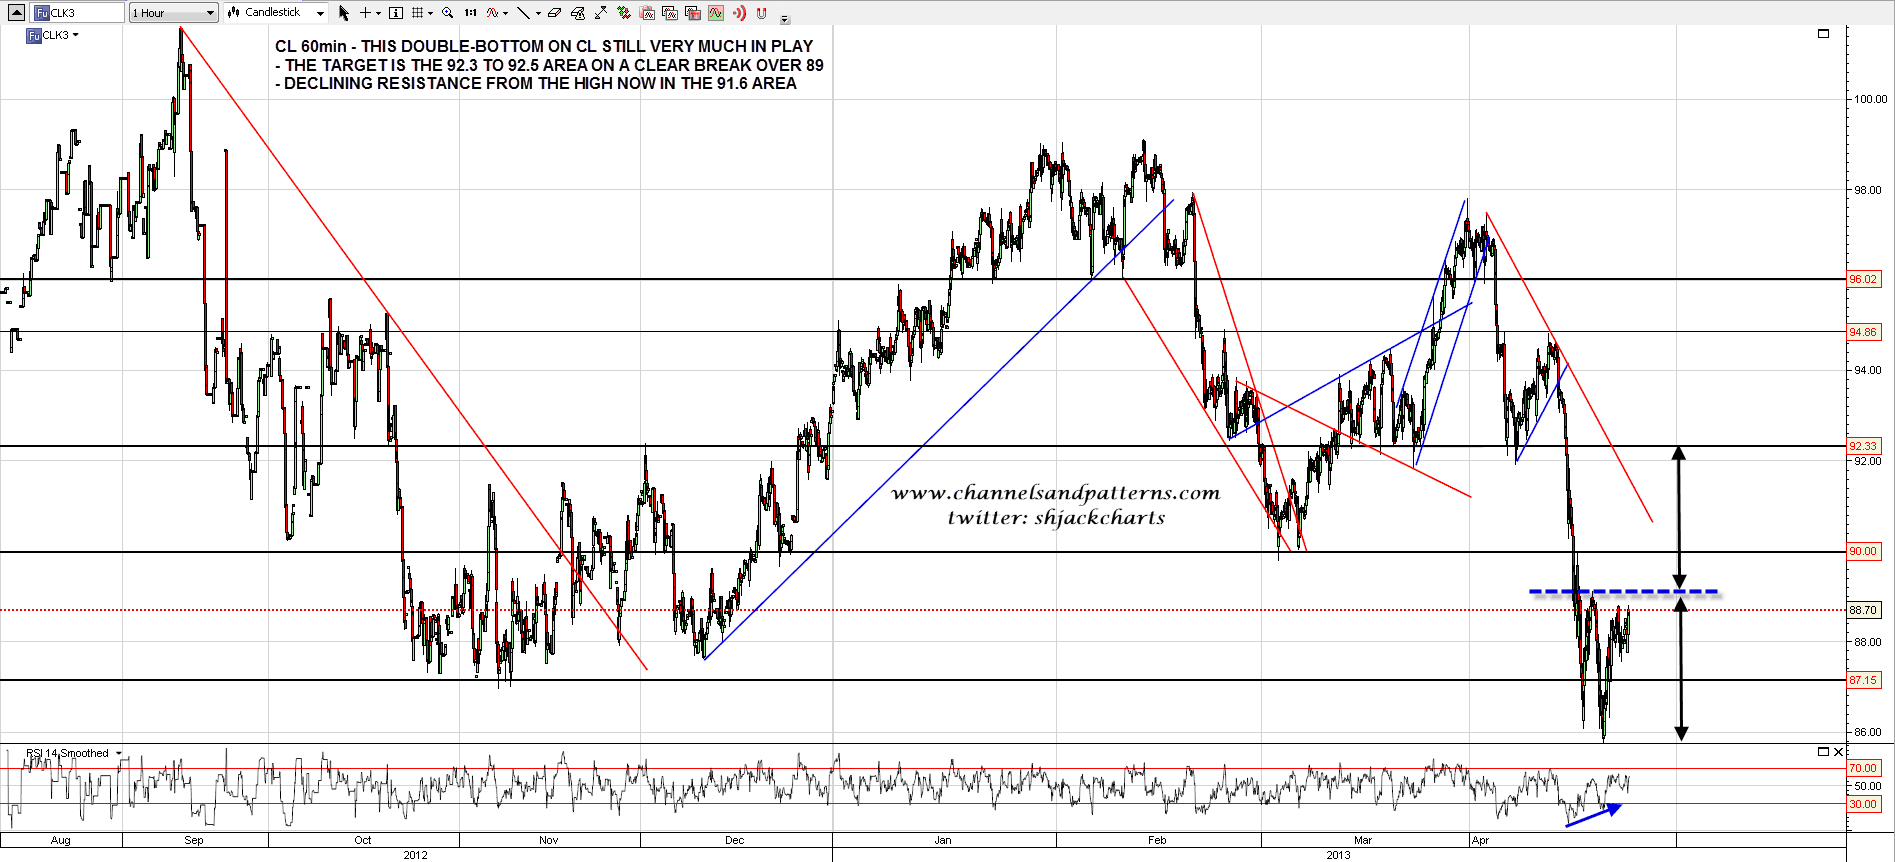
CL is still forming a possible double-top targeting the 92.3 to 92.5 area on a conviction break over 89:
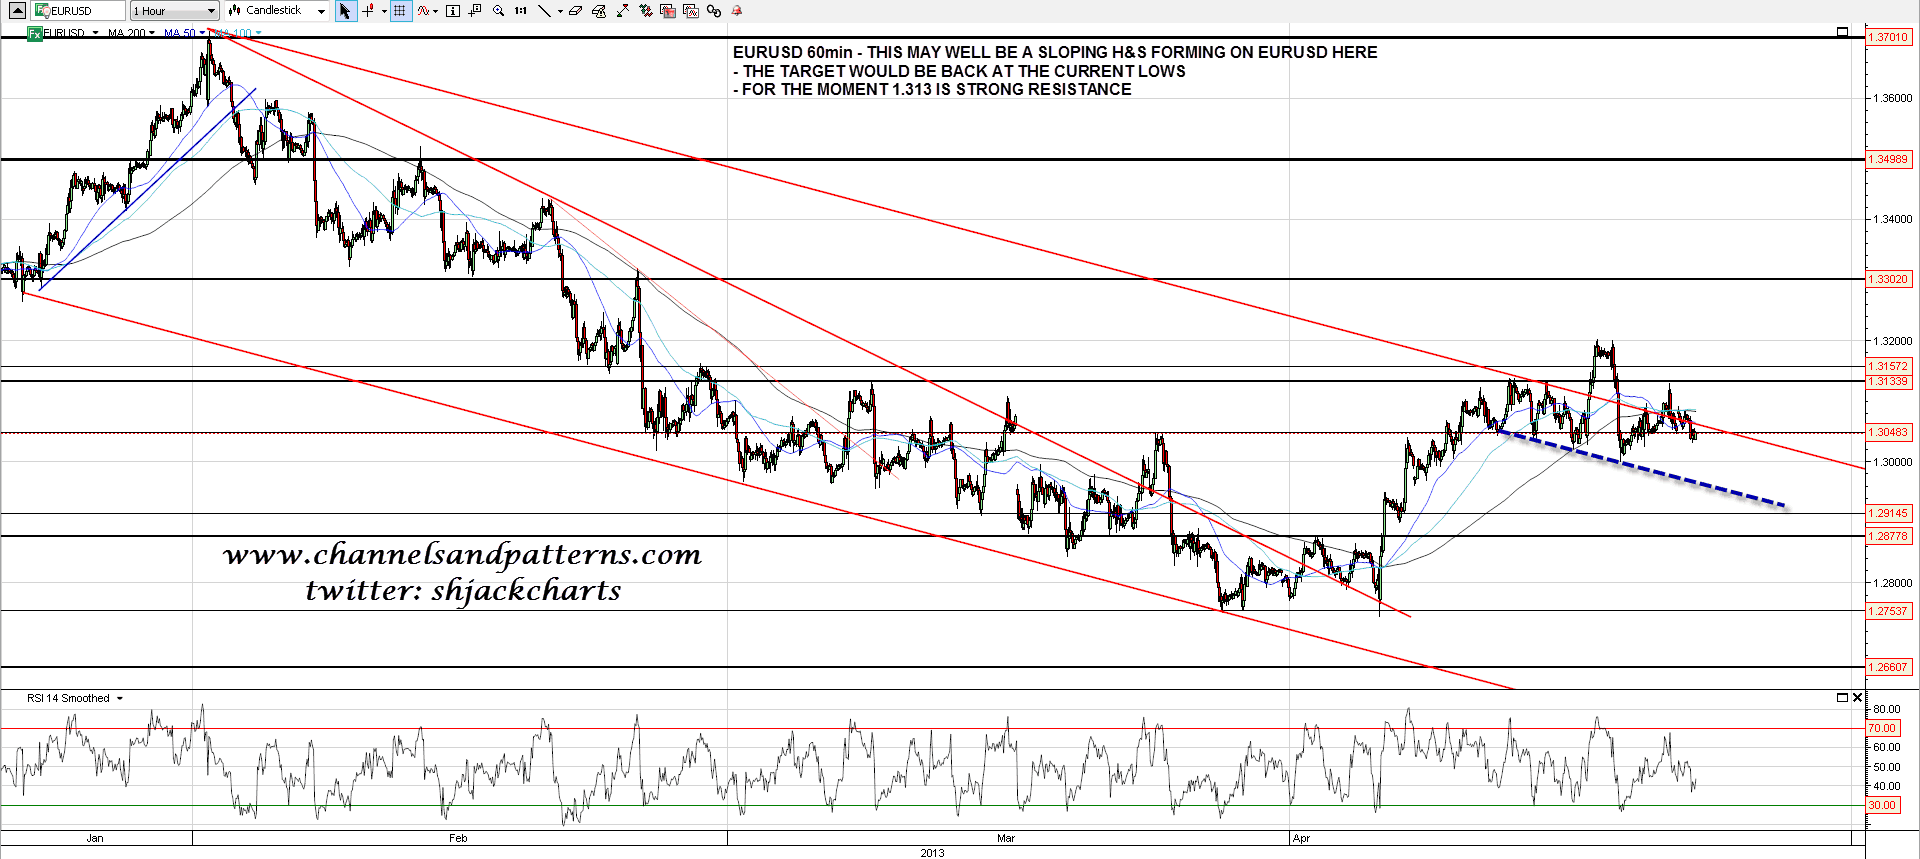
I’ve mentioned a few times that I’m doubtful about much more upside on EURUSD from here. Short term a bearish looking downsloping H&S is forming targeting a retest of the current lows and there is firm resistance in the 1.313 area:
For today I think we may well see the current opening gap fill and I’m expecting more upside after that.
