
SPX closed back just under the daily upper bollinger band on Friday. As long as this uptrend continues SPX should stick close to the upper band. If it starts to fall away then the chances are that an interim high will have been made:
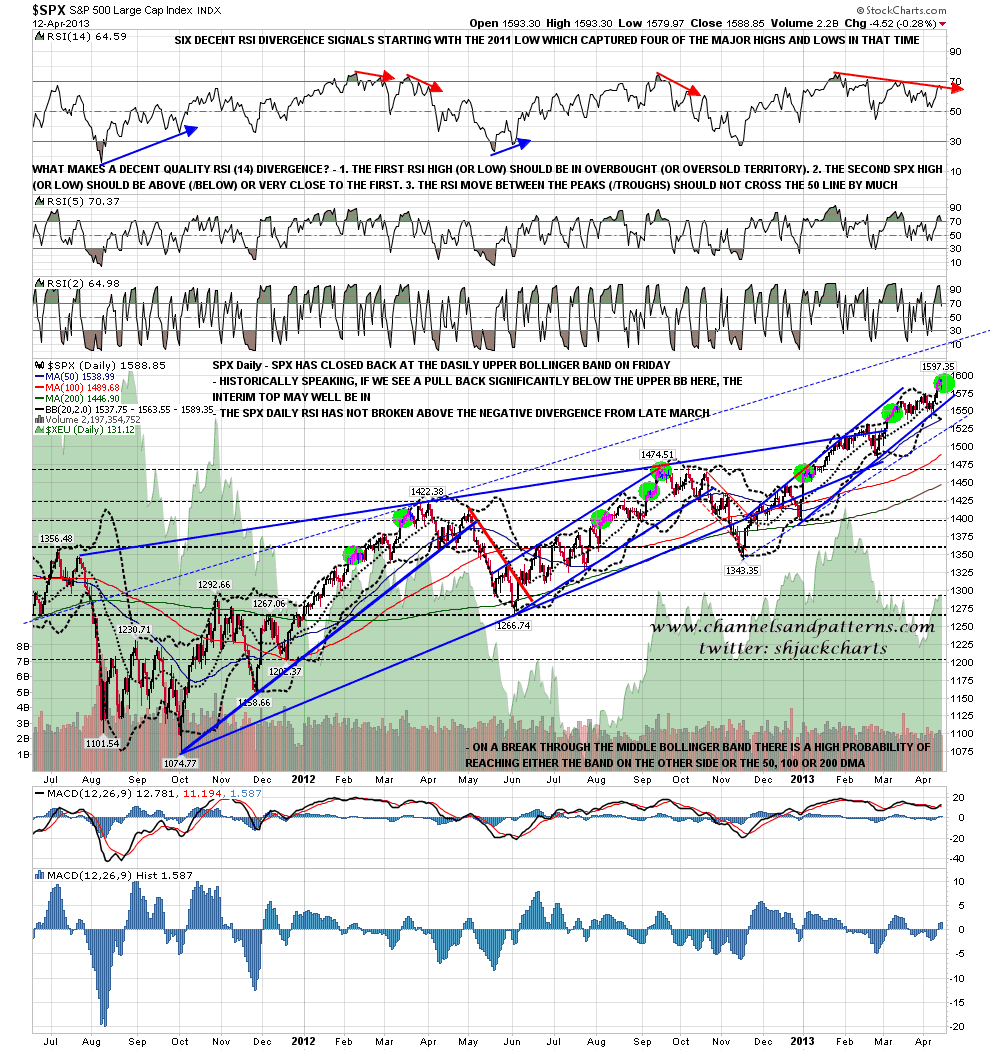
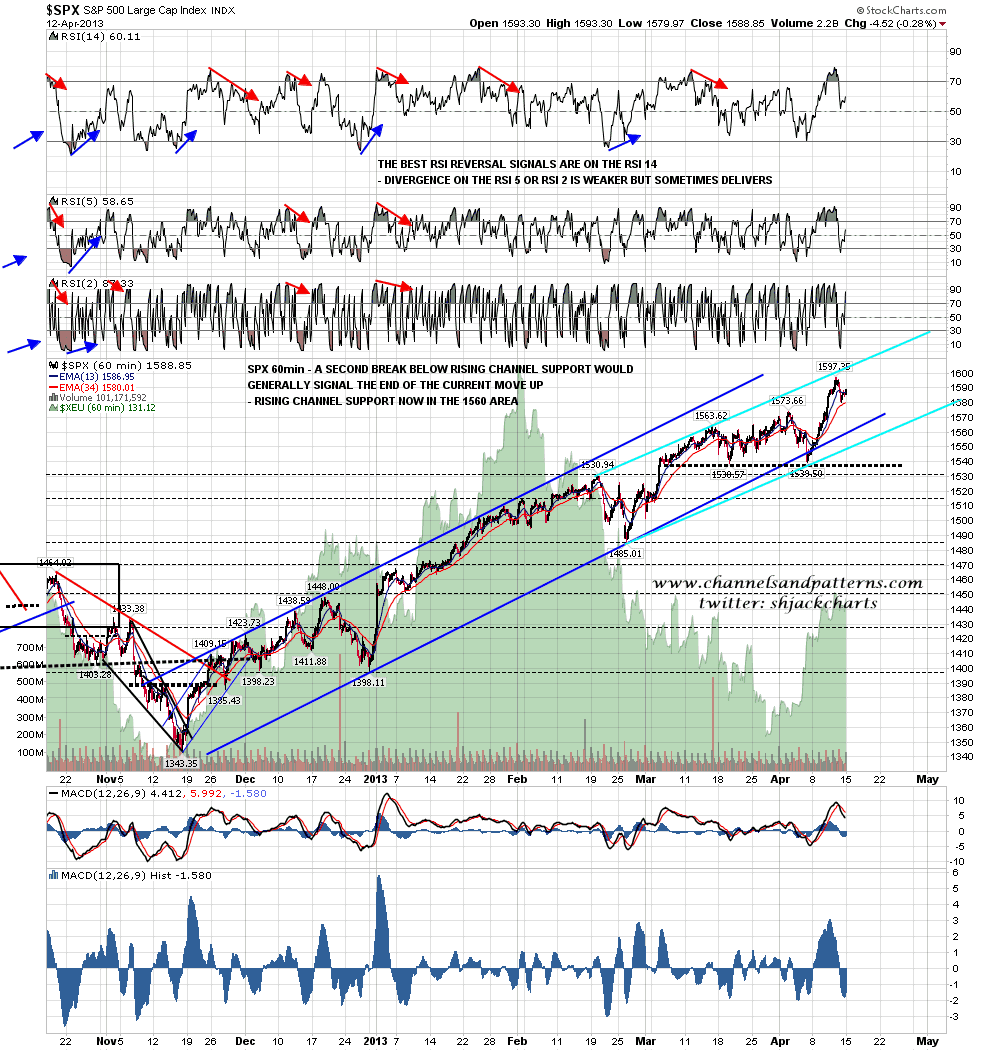
The second break of the rising channel on SPX since November is likely to be a strong break so I’ll be watching channel support which is now at 1560:
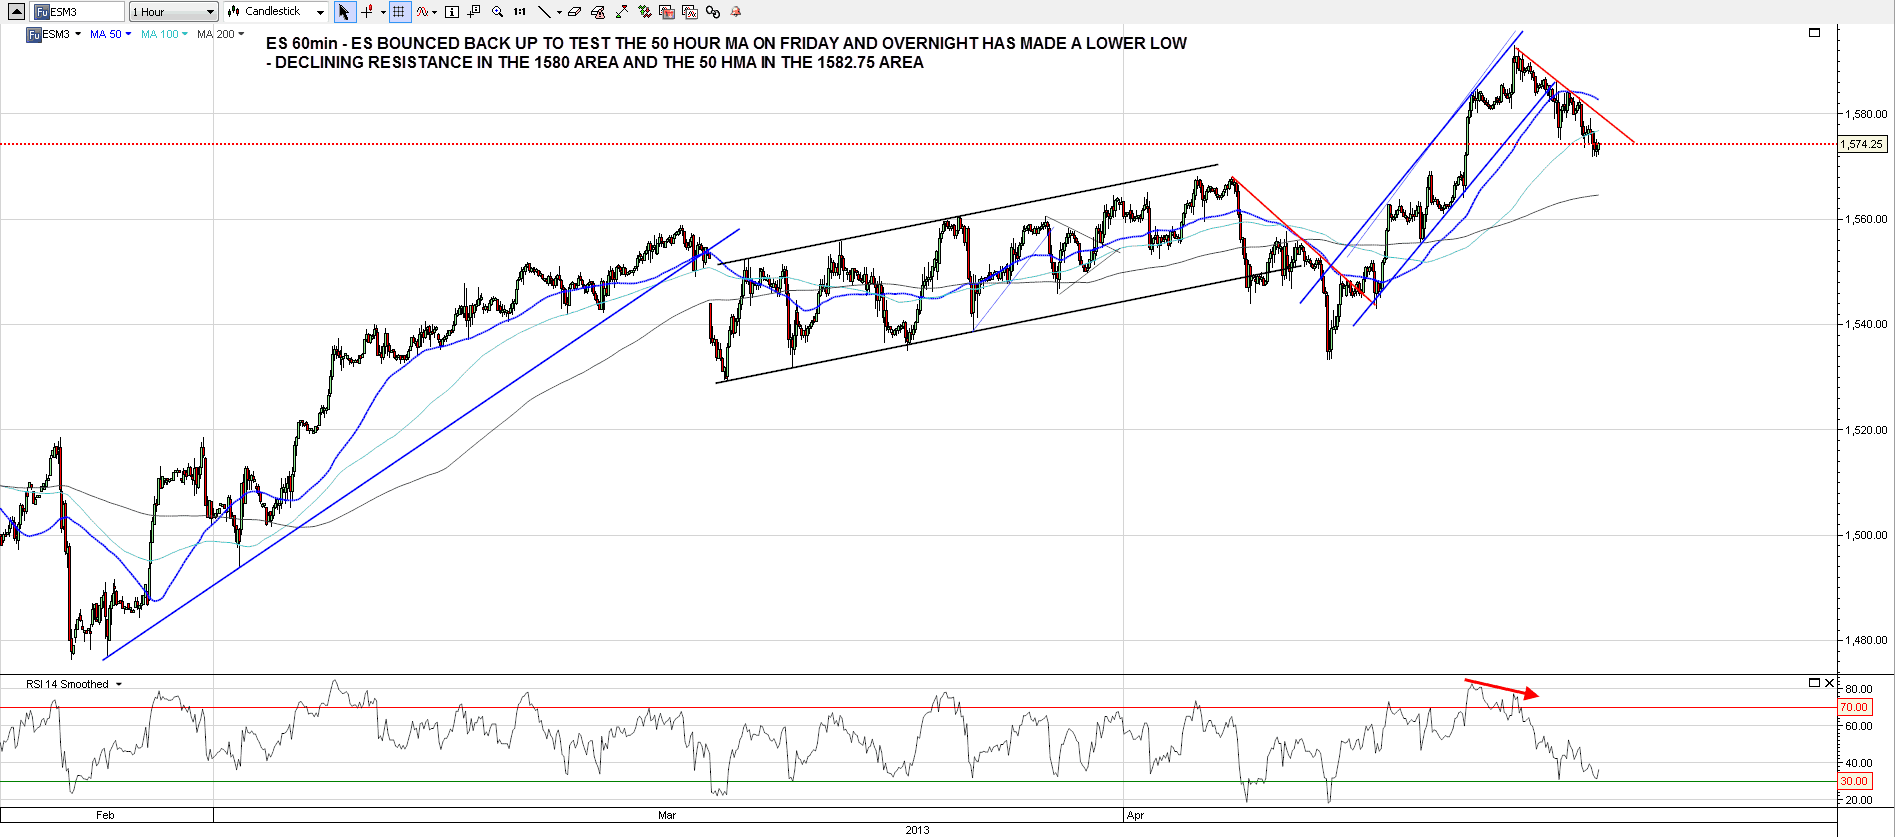
ES bounced on Friday to retest the 50 hour moving average and then reversed back down again to make a new low within my target zone 1570-4. Ideally we would see this hit within trading hours to retest broken resistance at the 2007 high. If ES is going to reverse back up this is the likely area. Declining resistance is in the 1580 area and the 50 HMA is now at 1582.75:
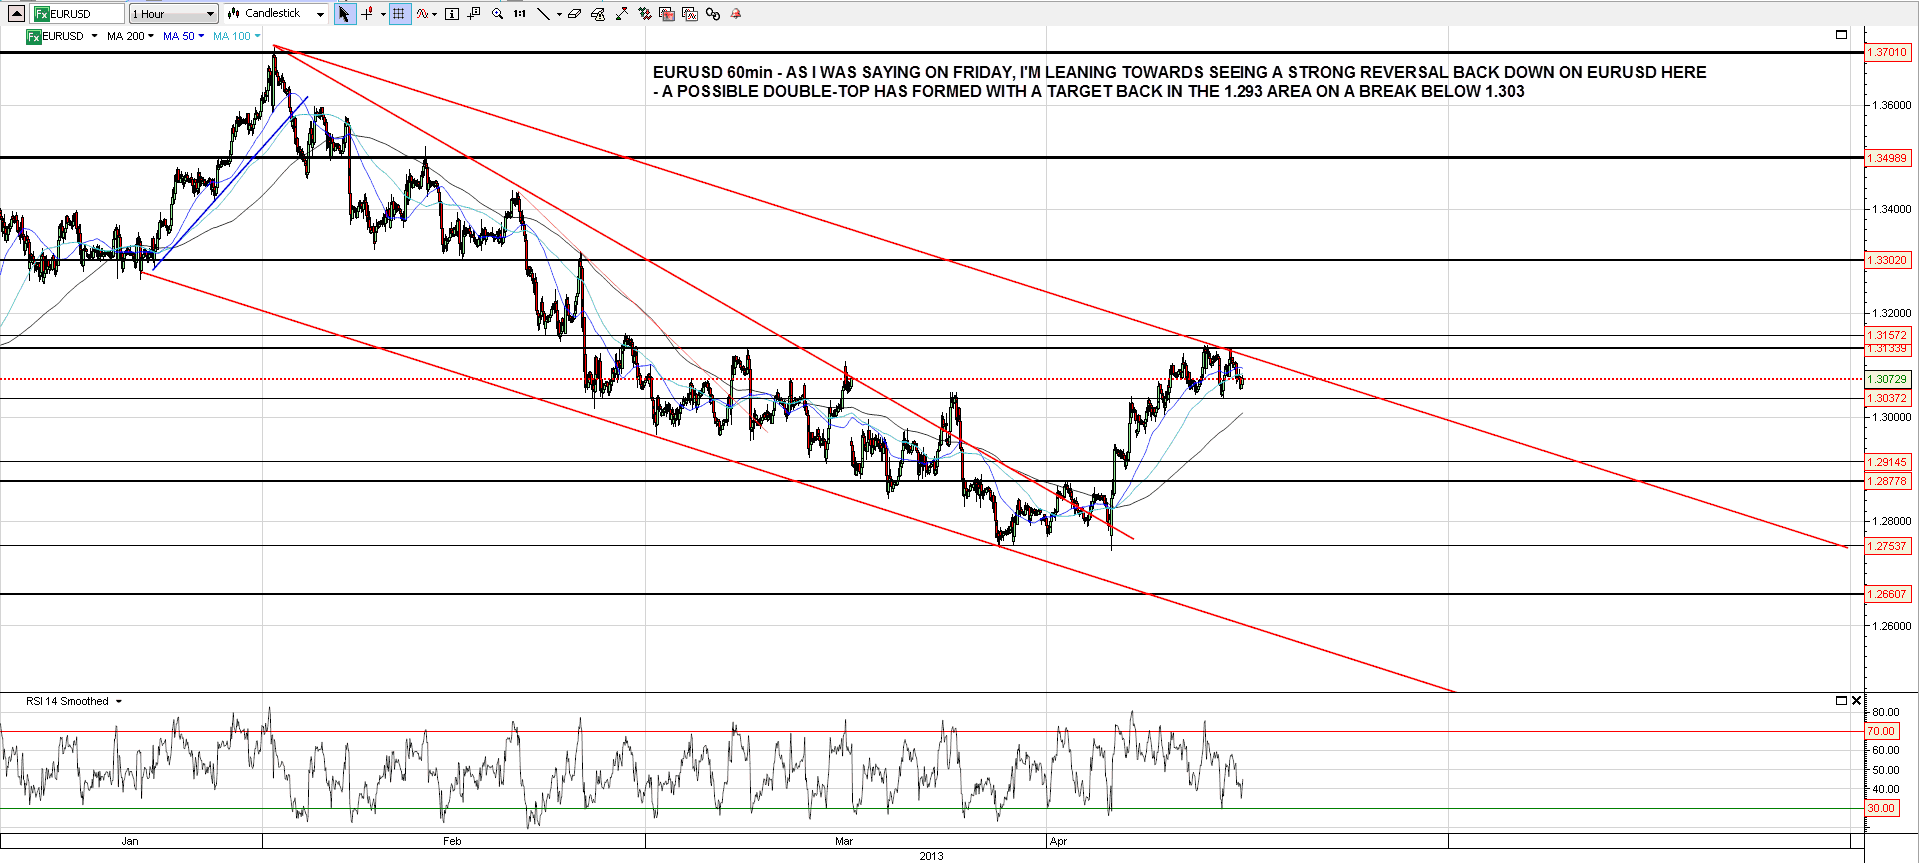
Related markets were very interesting on Friday. The least interesting was EURUSD, which has continued testing resistance and may be forming a small double top. As I said on Friday morning if we are going to see a strong reversal back down, which I think we may well see, then this is a very good place to see that with a declining channel now established from the rally high:
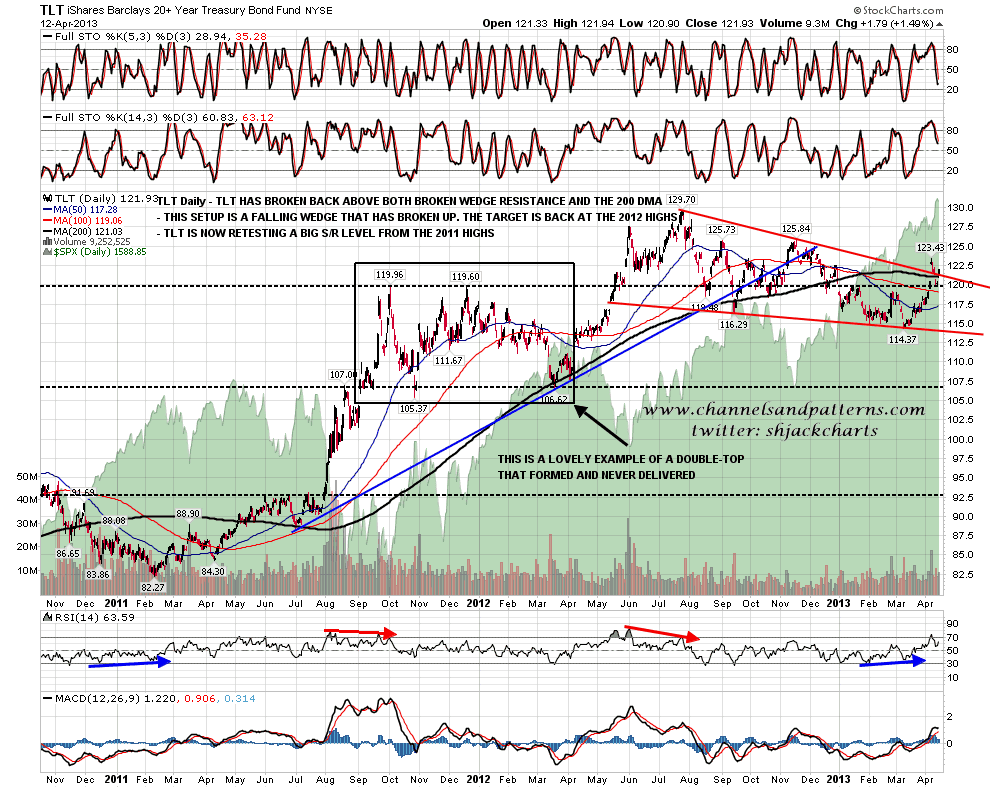
TLT broke back above broken falling wedge resistance and the 200 DMA on Friday and the bull scenario for a retest of the 2012 high at 129.70 is alive and looking well there:
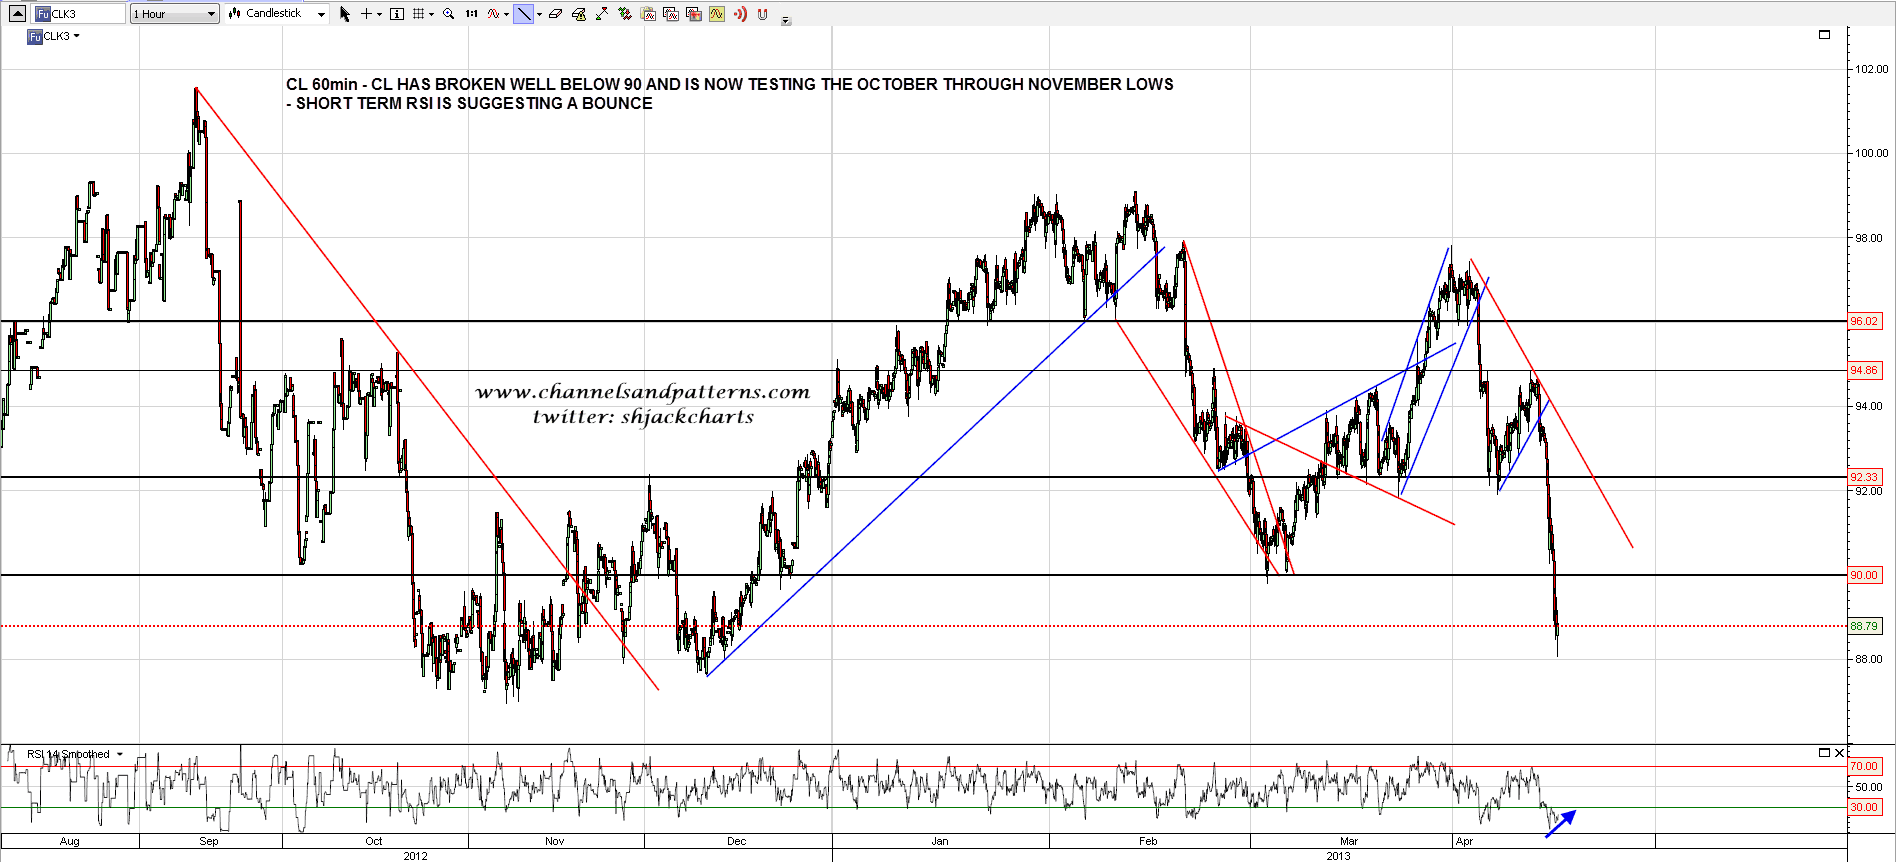
CL had a very bad day on Friday and broke back below the 92 support level. Overnight it also broke down below 90 support and is now testing the support area at the October through December lows. Short term RSI is suggesting we may well see a decent bounce here:
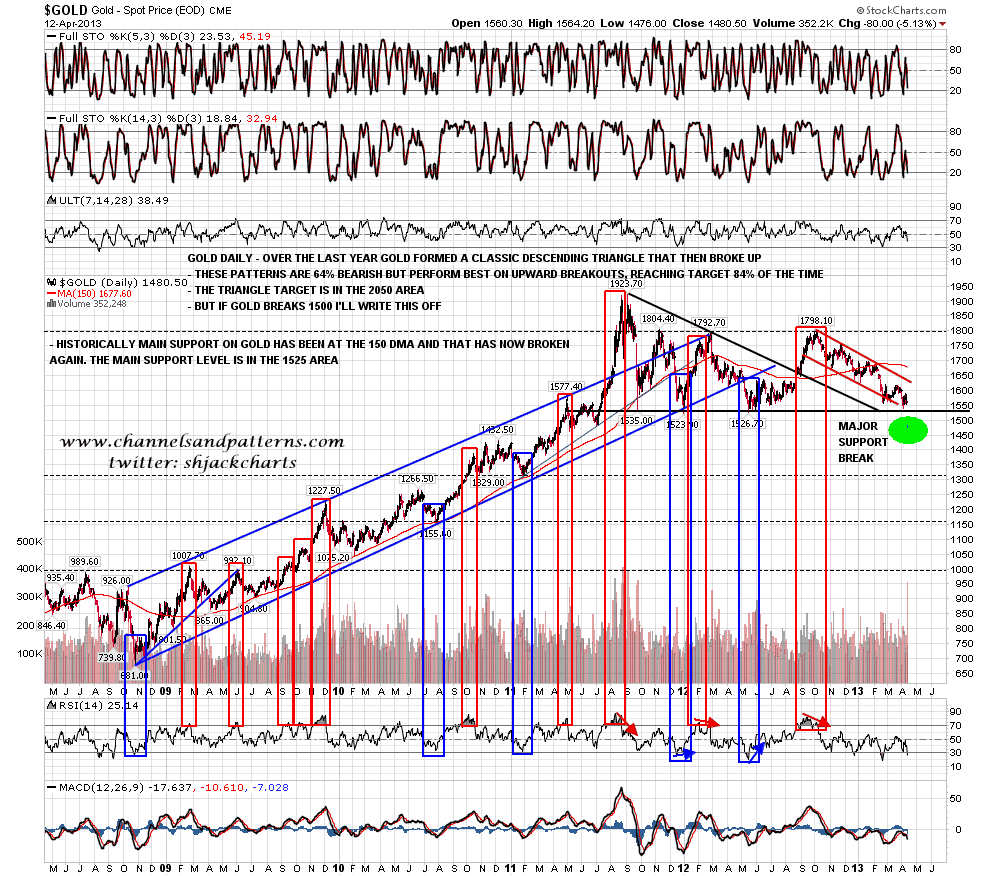
The really big news on Friday though was on precious metals with gold breaking below the very strong support zone 1520-35 with a lot of confidence. I’m expecting more downside and I have the next big support levels in the 1330 and 1150 areas. I’m still bullish on precious metals long term and will be looking hard for a buying opportunity as and when this move down has played out. That may well take a while:
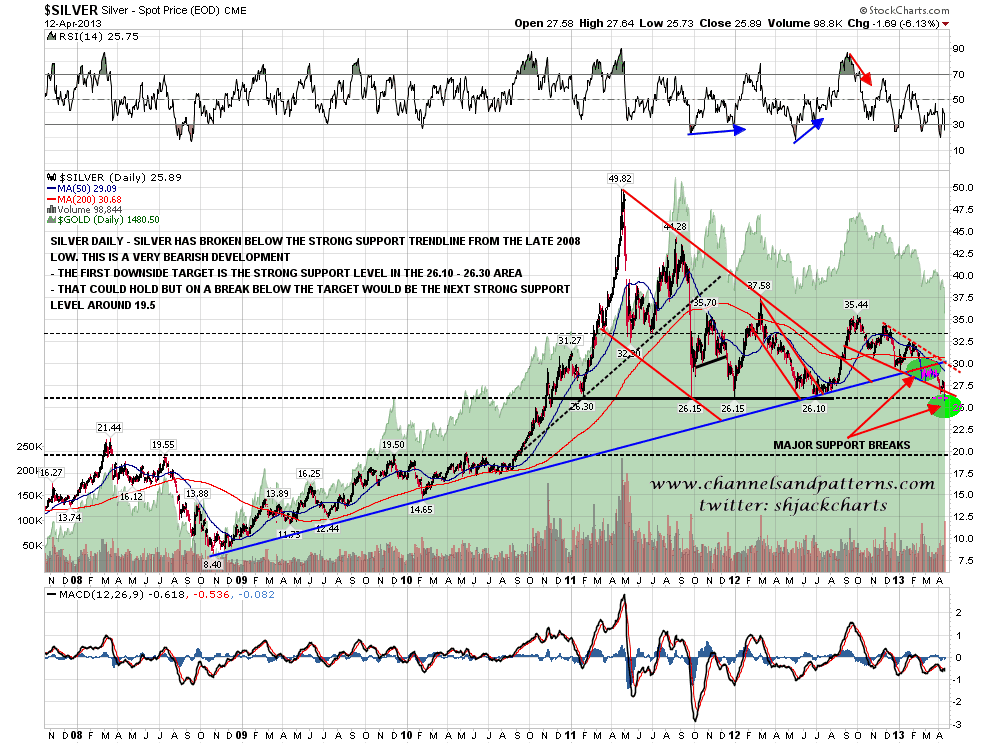
The support break looks less serious on the silver chart but with the additional break below rising support from the 2008 low just a couple of months ago the outlook looks just as grim for silver. I have the next major support level at 19.5 and silver may or may not hold there. I have left my comments on the gold and silver charts unchanged from when I last posted these a couple of weeks ago:
One opinion I was reading quite a bit last week was that while the Fed is printing $85bn per month, as it is currently with no end date to that announced, we will see no significant retracements on equities. I don’t think that’s right but this is currently untested either way so we don’t know the answer to this one yet. If it is right then the end of this QE program as and when we see that may be the shorting opportunity of the century.
On the assumption that isn’t true I am looking for a significant interim top to be made within four weeks or so at a level that should be near or very possibly well under the 1620 area. If we see significant weakness in the next day or two that interim top may already be in. If the market truly cannot fall during QE Infinity then obviously that won’t happen. I’d point out though that QE hasn’t been helping CL or copper much here, with CL now testing the lows made near the end of last year, and copper very well below them.
