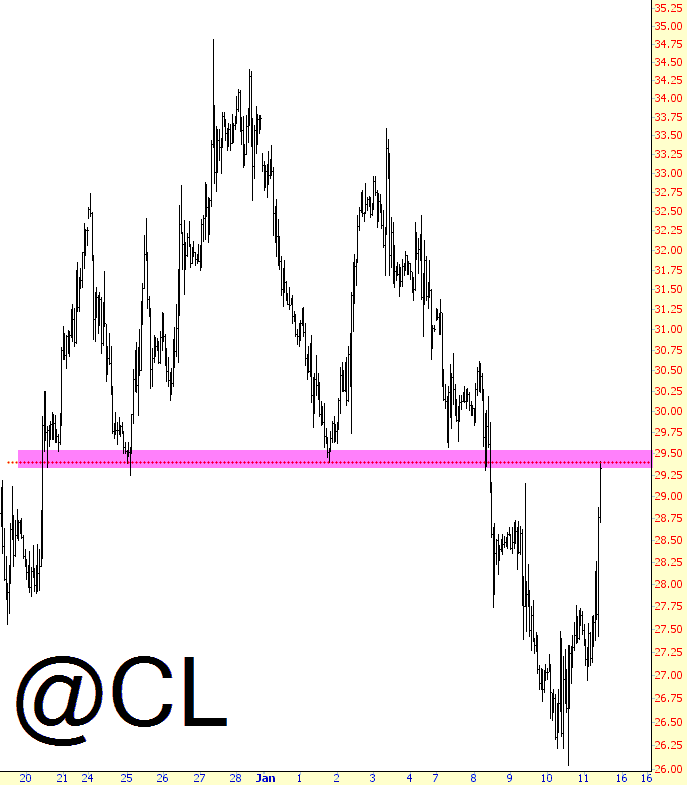
No one but me would be bold and insane enough to suggest fading this mega-rally, but that’s how I roll. I’m not shorting crude oil per se, but I’ll be looking hard at the energy sector:

Slope initially began as a blog, so this is where most of the website’s content resides. Here we have tens of thousands of posts dating back over a decade. These are listed in reverse chronological order. Click on any category icon below to see posts tagged with that particular subject, or click on a word in the category cloud on the right side of the screen for more specific choices.
No one but me would be bold and insane enough to suggest fading this mega-rally, but that’s how I roll. I’m not shorting crude oil per se, but I’ll be looking hard at the energy sector:

Half-term has started here and I was out with my daughter this morning so I’m running a bit late. I’m just going to show the futures charts this morning as I think they are telling the story best. These are the ES, NQ and TF bonus charts that I posted at theartofchart.net this morning.
On ES an IHS has broken up with a target in the 1870 area. That’s a match with the 61.8% fib retrace target at 1871 and a possible match with a currently theoretical falling channel resistance trendline, but that wouldn’t be in range until at least Sunday night without a break over the 1871 61.8% fib target and the last short term high at 1874. ES Mar 60min chart:
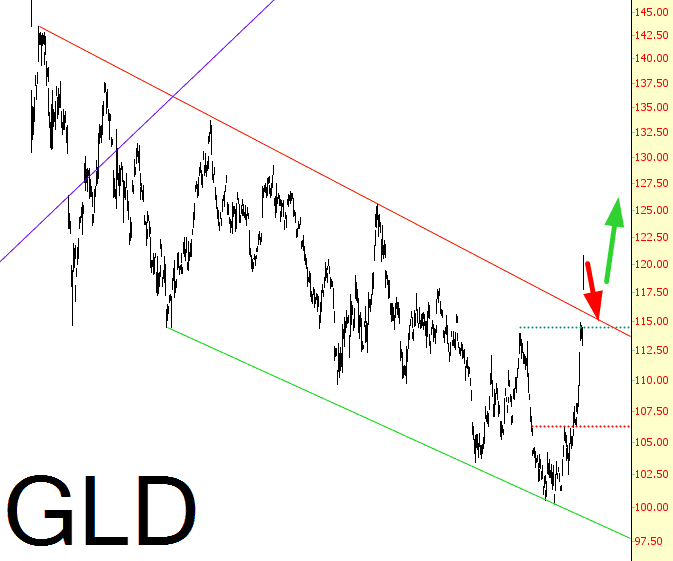
During yesterday’s amazing rush-up on gold (making Q1 2016 the best quarter for gold in thirty YEARS, and we’re not even halfway into the quarter yet!) I did a post stating I was shorting the miners into the strength (in dollar terms. Heh.) To be specific, I am short GDX (big), RGLD (small), and SLW (small). Judging from pre-market action, that looks like a good move.
To be clear, however, just as I think a bear market in equities started last year, I believe a bull market in gold has begun as of just a couple of months ago. We’ve escaped the channel, and once we get a little selling, I think we’re in for a push higher.

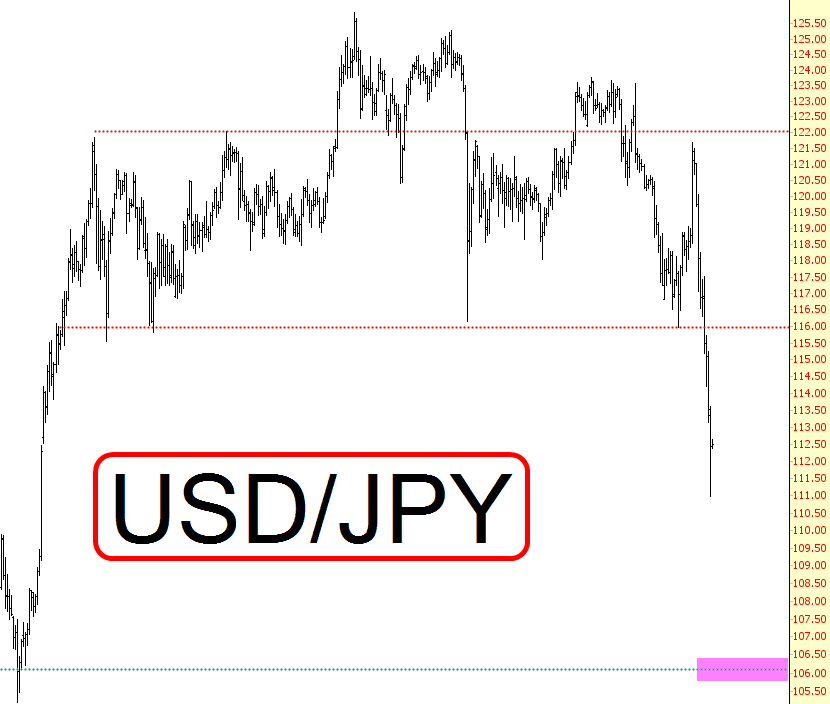
Which is terribly important, since that’ll probably mark a level of support for equities:
