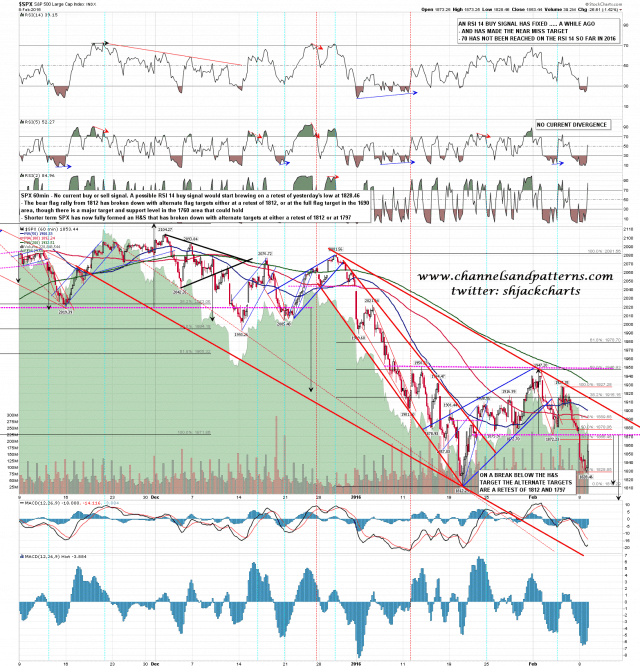
The H&S on SPX broke down yesterday with alternate targets at a retest of 1812 and 1797. I’m not seeing any reason to think that we won’t at least see a retest of 1812 and given that today is also a cycle trend day, it’s very possible that we see that target made today. SPX 60min chart:
Slope of Hope Blog Posts
Slope initially began as a blog, so this is where most of the website’s content resides. Here we have tens of thousands of posts dating back over a decade. These are listed in reverse chronological order. Click on any category icon below to see posts tagged with that particular subject, or click on a word in the category cloud on the right side of the screen for more specific choices.
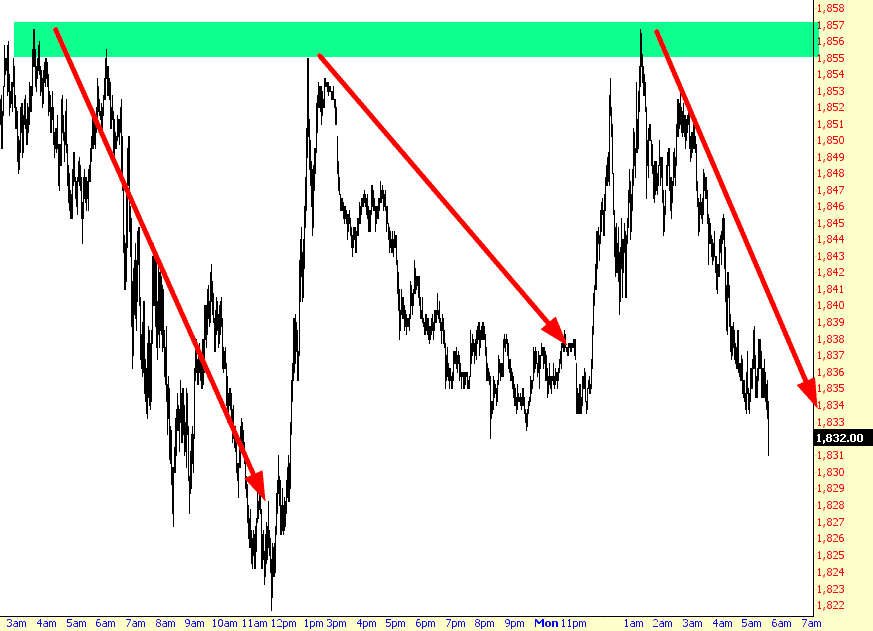
Nighttime Resistance
Well, I could get used to this. It seems that the bulls keep trying to power the market higher, but in their new role as Feckless Flops, they just can’t do it, even with central bank ninnies running around trying to jawbone (a trick which has run its course). Witness what keeps happening with surprising regularity:

Macro Changes
The following is the opening segment of this week’s edition of Notes From the Rabbit Hole, NFTRH 381…
A picture is worth 4-plus years and thousands of words, and the picture below has a lot to say. I’ll say some words as well, since I have kept them bottled up for years in an effort to make sure we operate with discipline as opposed to gold bug style emotion.
The bear market and subsequent inflation-fueled credit bubble early last decade was when I first started paying close attention to macro markets (as opposed to stock trading, which I had done for a few years prior) and how they operate. Having seen well paid professionals lose half of my IRA in 2002, I took over all of our finances and never looked back. But I needed to understand how markets worked and that has been a challenging and rewarding endeavor, not to mention an ongoing learning experience.
Yen Breaks Out
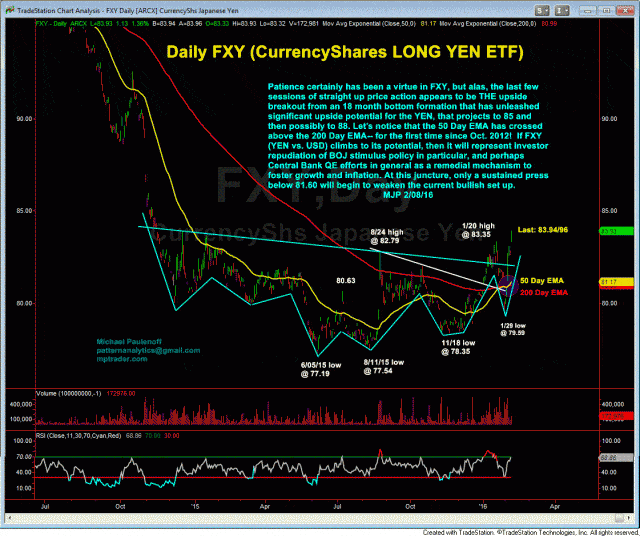
Patience certainly has been a virtue in CurrencyShares Japanese Yen ETF (FXY), but alas, the last few sessions of straight-up price action appears to be the upside breakout from an 18-month bottom formation that has unleashed significant upside potential for the YEN, that projects to 85 and then possibly to 88.
Let’s notice that the 50-Day EMA has crossed above the 200-Day EMA– for the first time since Oct 2012!
If FXY (YEN vs. USD) climbs to its potential, then it will represent investor repudiation of BOJ stimulus policy in particular, and perhaps Central Bank QE efforts in general as a remedial mechanism to foster growth and inflation.
At this juncture, only a sustained press below 81.60 will begin to weaken the current bullish set-up.


