
SPX 60min RSI 14 and RSI 5 buy signals fixed at the close last night, and the various decline patterns on ES, NQ and TF all broke up overnight. I suspect strongly that this is a rally before another leg down and if so, then the resistance levels that I’m watching here are the retest of the daily middle band from below at the broken floor at 2085, then the 5dma in the 2095-7 area that should be bolstered by the 50 hour MA as well if reached. If that area gets turned into support then the retrace from the highs is likely over.
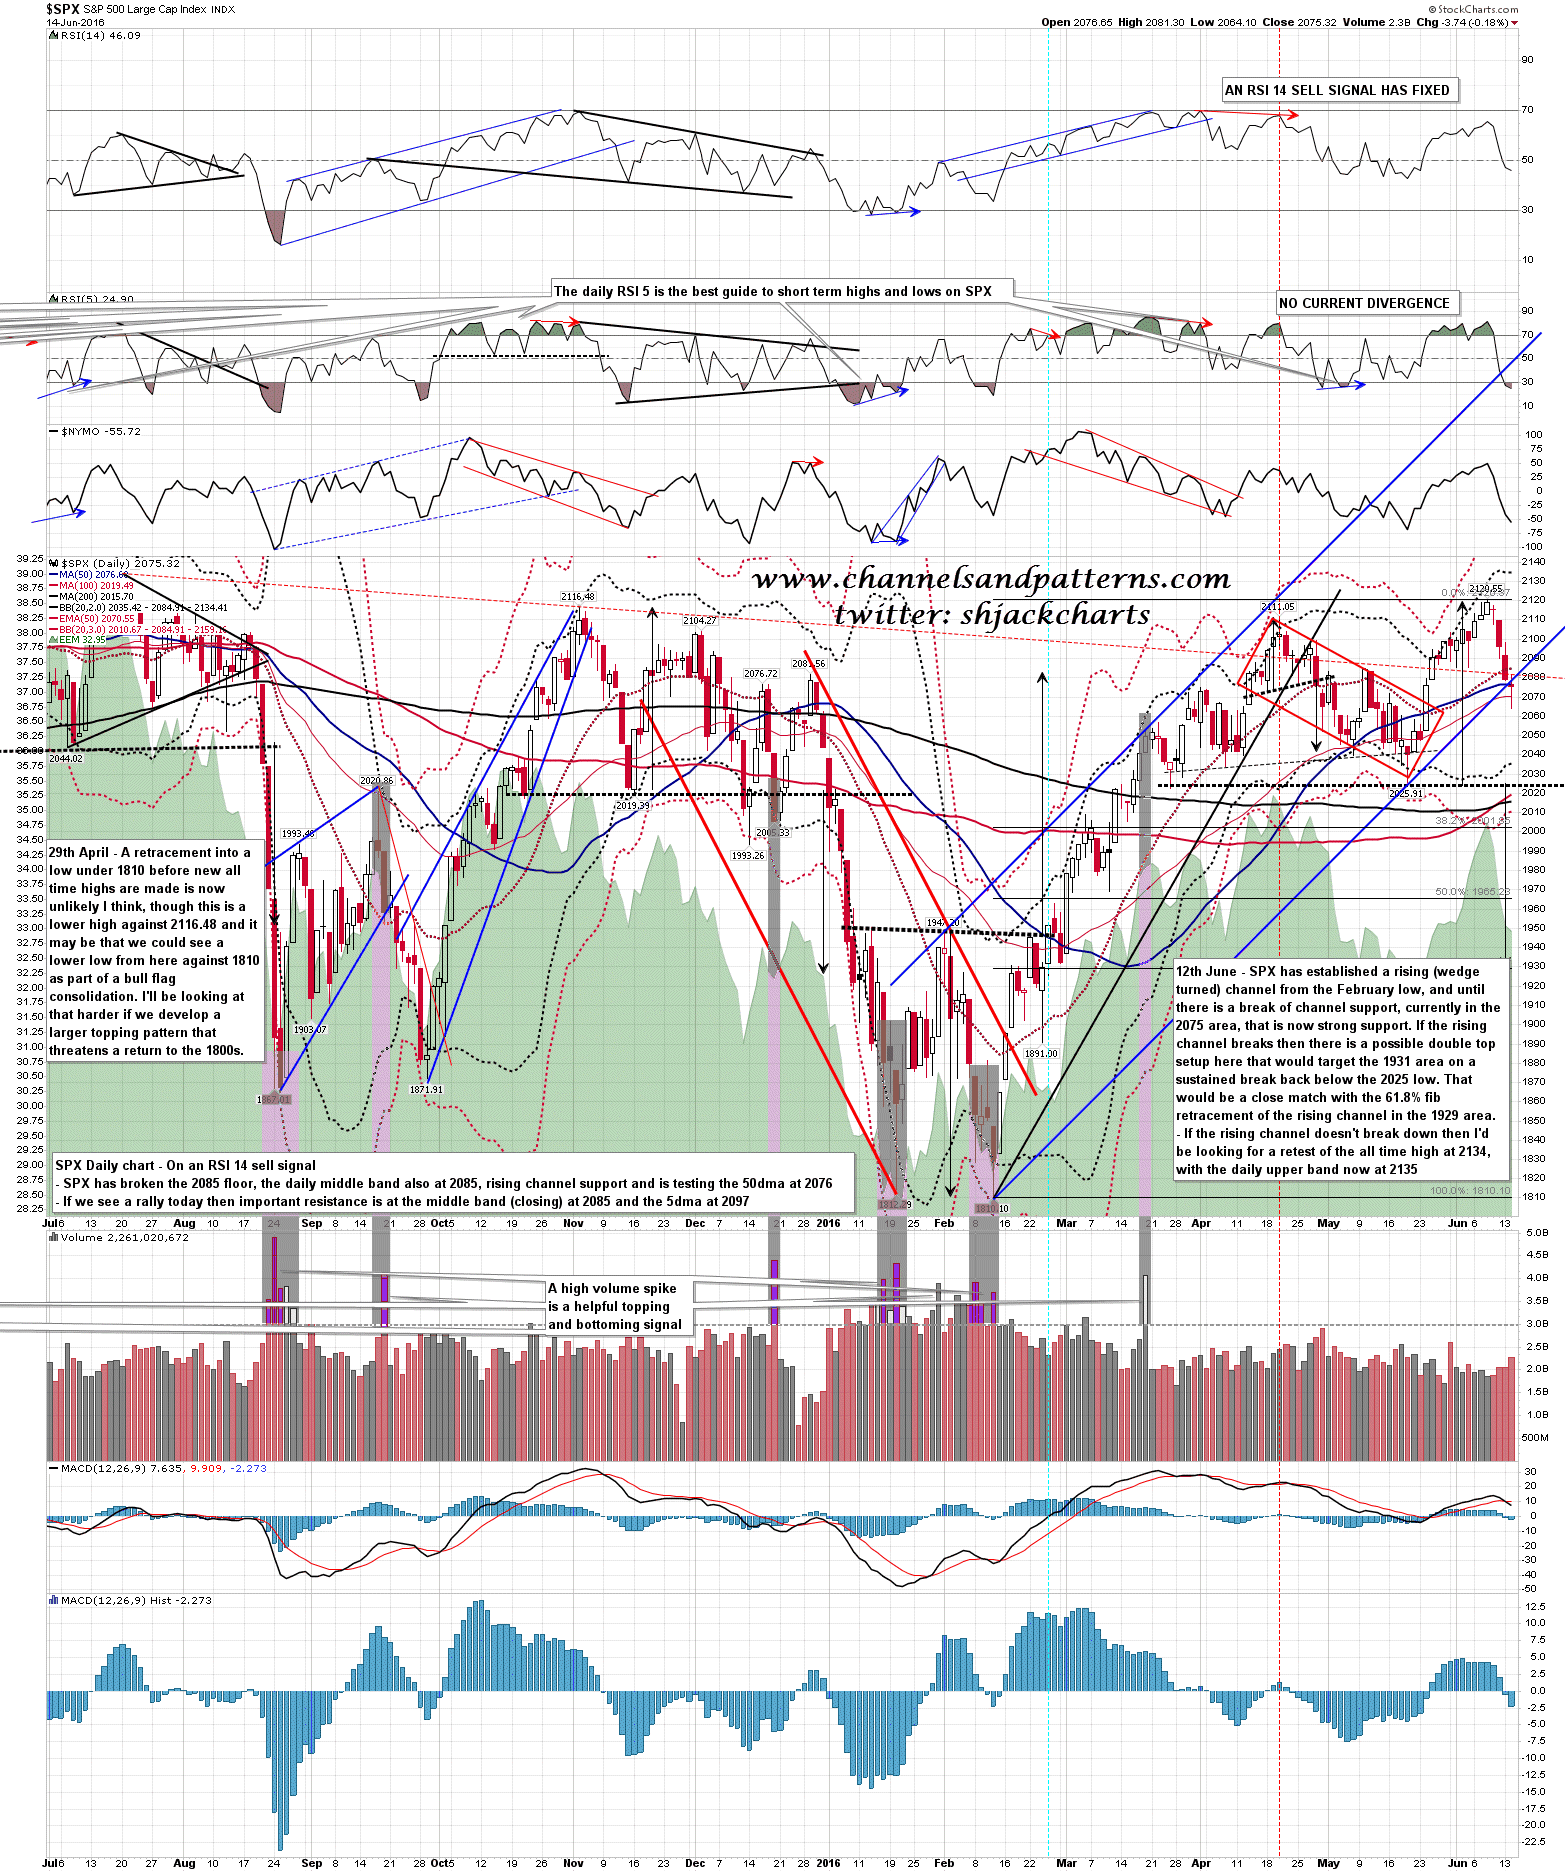
On the SPX daily chart main rising channel support from the Feb low was broken at the open yesterday. That was an important break and opens up what may be a much deeper retracement. On a sustained break below the last serious low at 2025 the double top target would be in the 1930 area, which would almost exactly be a 61.8% fib retracement of the rising channel from the February low. After yesterday morning’s break that possible retracement target is in the mix now. SPX daily chart:
The falling megaphone from the high on ES broke up overnight. There is an open 60min buy signal that is suggesting that the rally has further to go than the 2075/6 test seen so far. ES Sep 60min chart:

The big news today is the Fed at 2pm. I think Yellen is going to make a statement and I’m going to take a flier and predict that whatever she says will lean dovish. That’s the wild card today though so be aware of that when the time comes.
Stan and I are doing a free to all educational webinar on trendlines at theartofchart.net after the close tomorrow. Among other things we will be talking about the correct way to draw and place trendlines, and based on charts that I see posted around the web, there are a lot of people that could benefit from that. If you’d like to attend you can register for that here.
