In my 2017 Market Wrap-Up post, I referenced major support (200) and resistance (280) as levels worth monitoring on the SPX:VIX ratio, on a monthly timeframe.
The following updated monthly chart of the SPX:VIX ratio reveals a few interesting things:
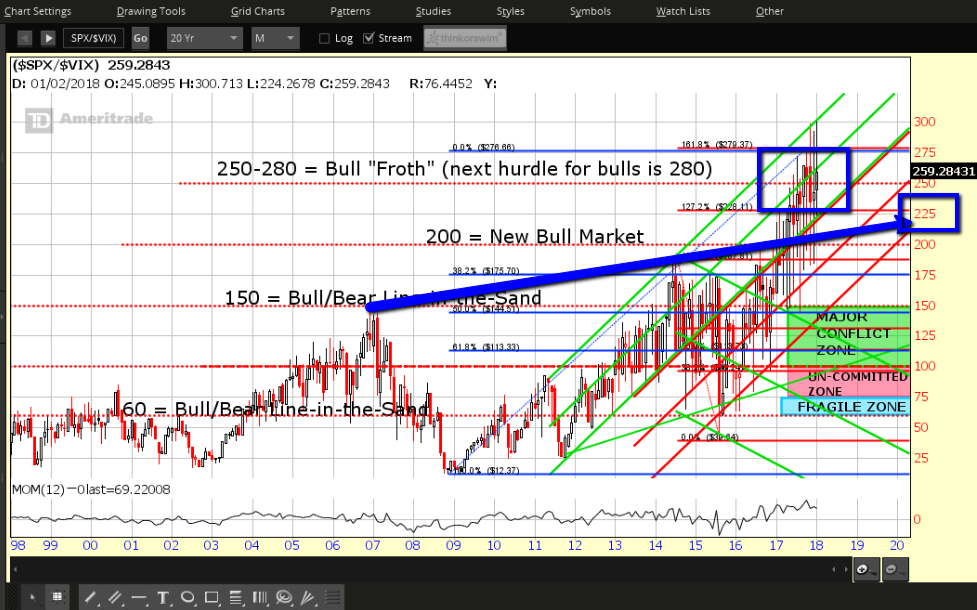
- All of the monthly closes since July 2017 have been above 225.
- December ’17 and January ’18 have spiked above the 280 resistance level, but not yet held above.
- A long-term uptrend line (heavy blue arrow) indicates near-term support around 225, at the moment.
- 225 is confluent with a major external Fibonacci retracement level at 228, as well as the bottom of the original long-term uptrending (green) channel.
- In my post of February 24, 2017, I identified 200 as a new level to be held above, in order to support a new bull market in equities.
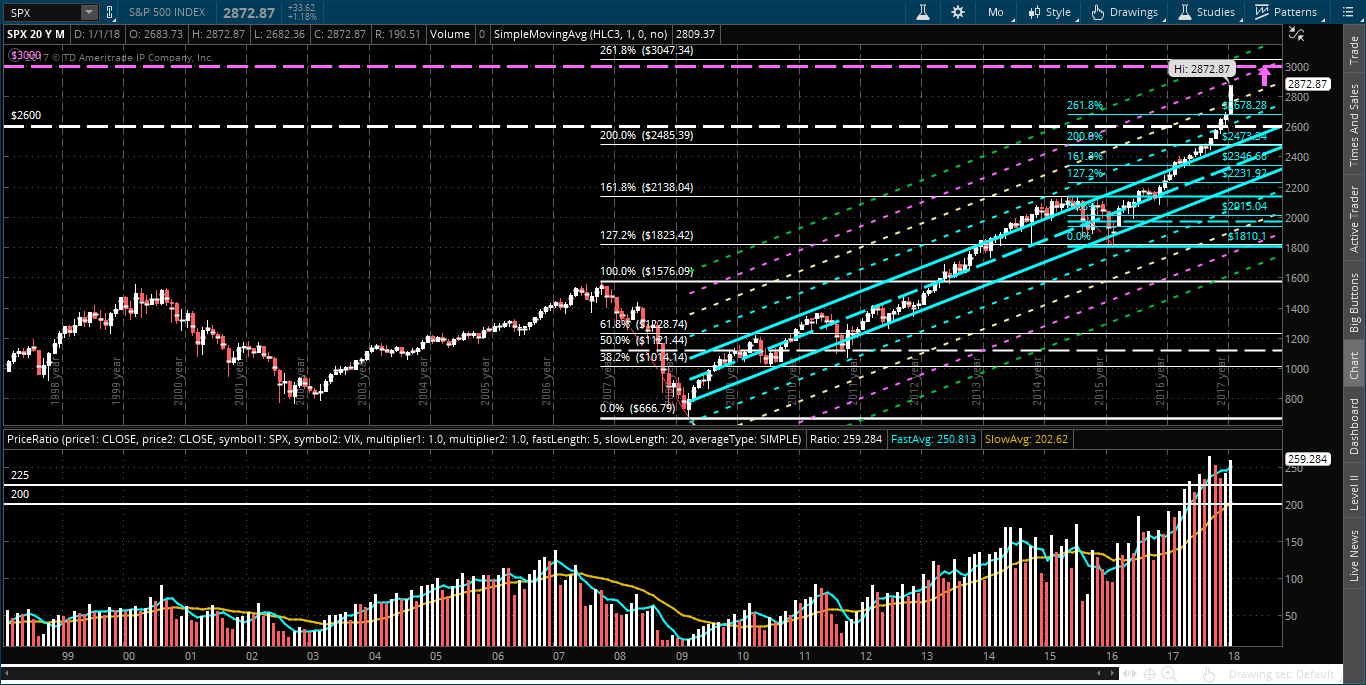
- In April, 2017 we started to see closes above 200 (the next monthly chart shows the SPX in the upper half and the monthly closes (in histogram format) of the SPX:VIX ratio in the lower half, for a different perspective).
- Monthly momentum on the SPX:VIX ratio began to weaken last November, which hasn’t supported the price breakout on the SPX above 2600.
From these observations, I’d make the following statements (based on a longer-term monthly timeframe and outlook):
- Watch 225 closely on the SPX:VIX ratio to see if price can continue to close above that level.
- If so, I’d need to see the momentum on this ratio strengthen, again, to support higher SPX prices.
- If we don’t see a reversal in momentum, it’s doubtful that the SPX will reach a target price of 3000 anytime soon, as I had described in my post of January 23.
- If price on this ratio falls and holds below major support at 200, volatility will rise dramatically and we’ll likely see some major profit-taking occur in the SPX.
- In the shorter term, you can also monitor activity in HYG and XHB, as I recently described here and here, respectively, in connection with the SPX.
* UPDATE January 29 @ 1:55 pm ET…
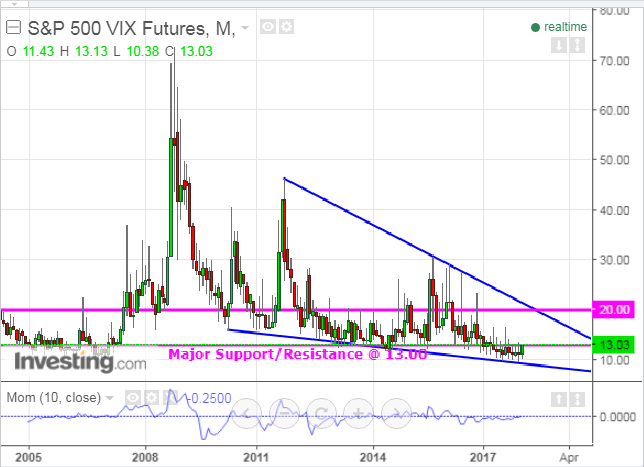
One last indicator to monitor over the coming weeks/months is the monthly momentum of the VIX, as depicted on the monthly chart below. It’s currently rising, but is still below the zero level, where it has languished since mid-2016. A crossover and hold above will see volatility increase.
Price will have to break and hold above 13.00, currently major resistance, for any meaningful volatility to affect equities…it’s attempting to do so, at the moment, and has been swirling around that price all day, so far.
The next major hurdle lies above at 20.00, where it faces a confluence of price and trendline major resistance.