I had an interesting question on my twitter that I answered this morning, and it was in response to my tweet at the open on Friday saying that both ES and NQ had formed clear bullish triangles and that I was expecting ATH retests on both. The question was from later in the day when the ATH retests had been done and both indices continued up in a trend day. The question was why the outlook had changed, and my reply this morning was to point out that I had tweeted that I was expecting the retests, but that I had never added that ES and NQ would reverse there. The outlook had not therefore changed. I had expanded on that in Friday’s intraday video before the main move up, but there’s only so much you can put into a tweet. What was interesting about the question is how people read beyond what is actually said. Something I see regularly.
The question today is whether we are seeing an inside day before a higher high (preferred option), or whether the triangle thrust has already ended. The dividing line on ES for me is the break and conversion of the new weekly pivot at 2851. If that turns resistance then ES likely continues down. In this context these triangles are likely termination patterns, so the obvious move after the triangle thrusts end is to deliver a retracement so large that it can be seen with the naked eye. It’s been a while since we saw one of those, so that would certainly be an interesting change of pace. Intraday Video from theartofchart.net – Update on ES, NQ and TF:
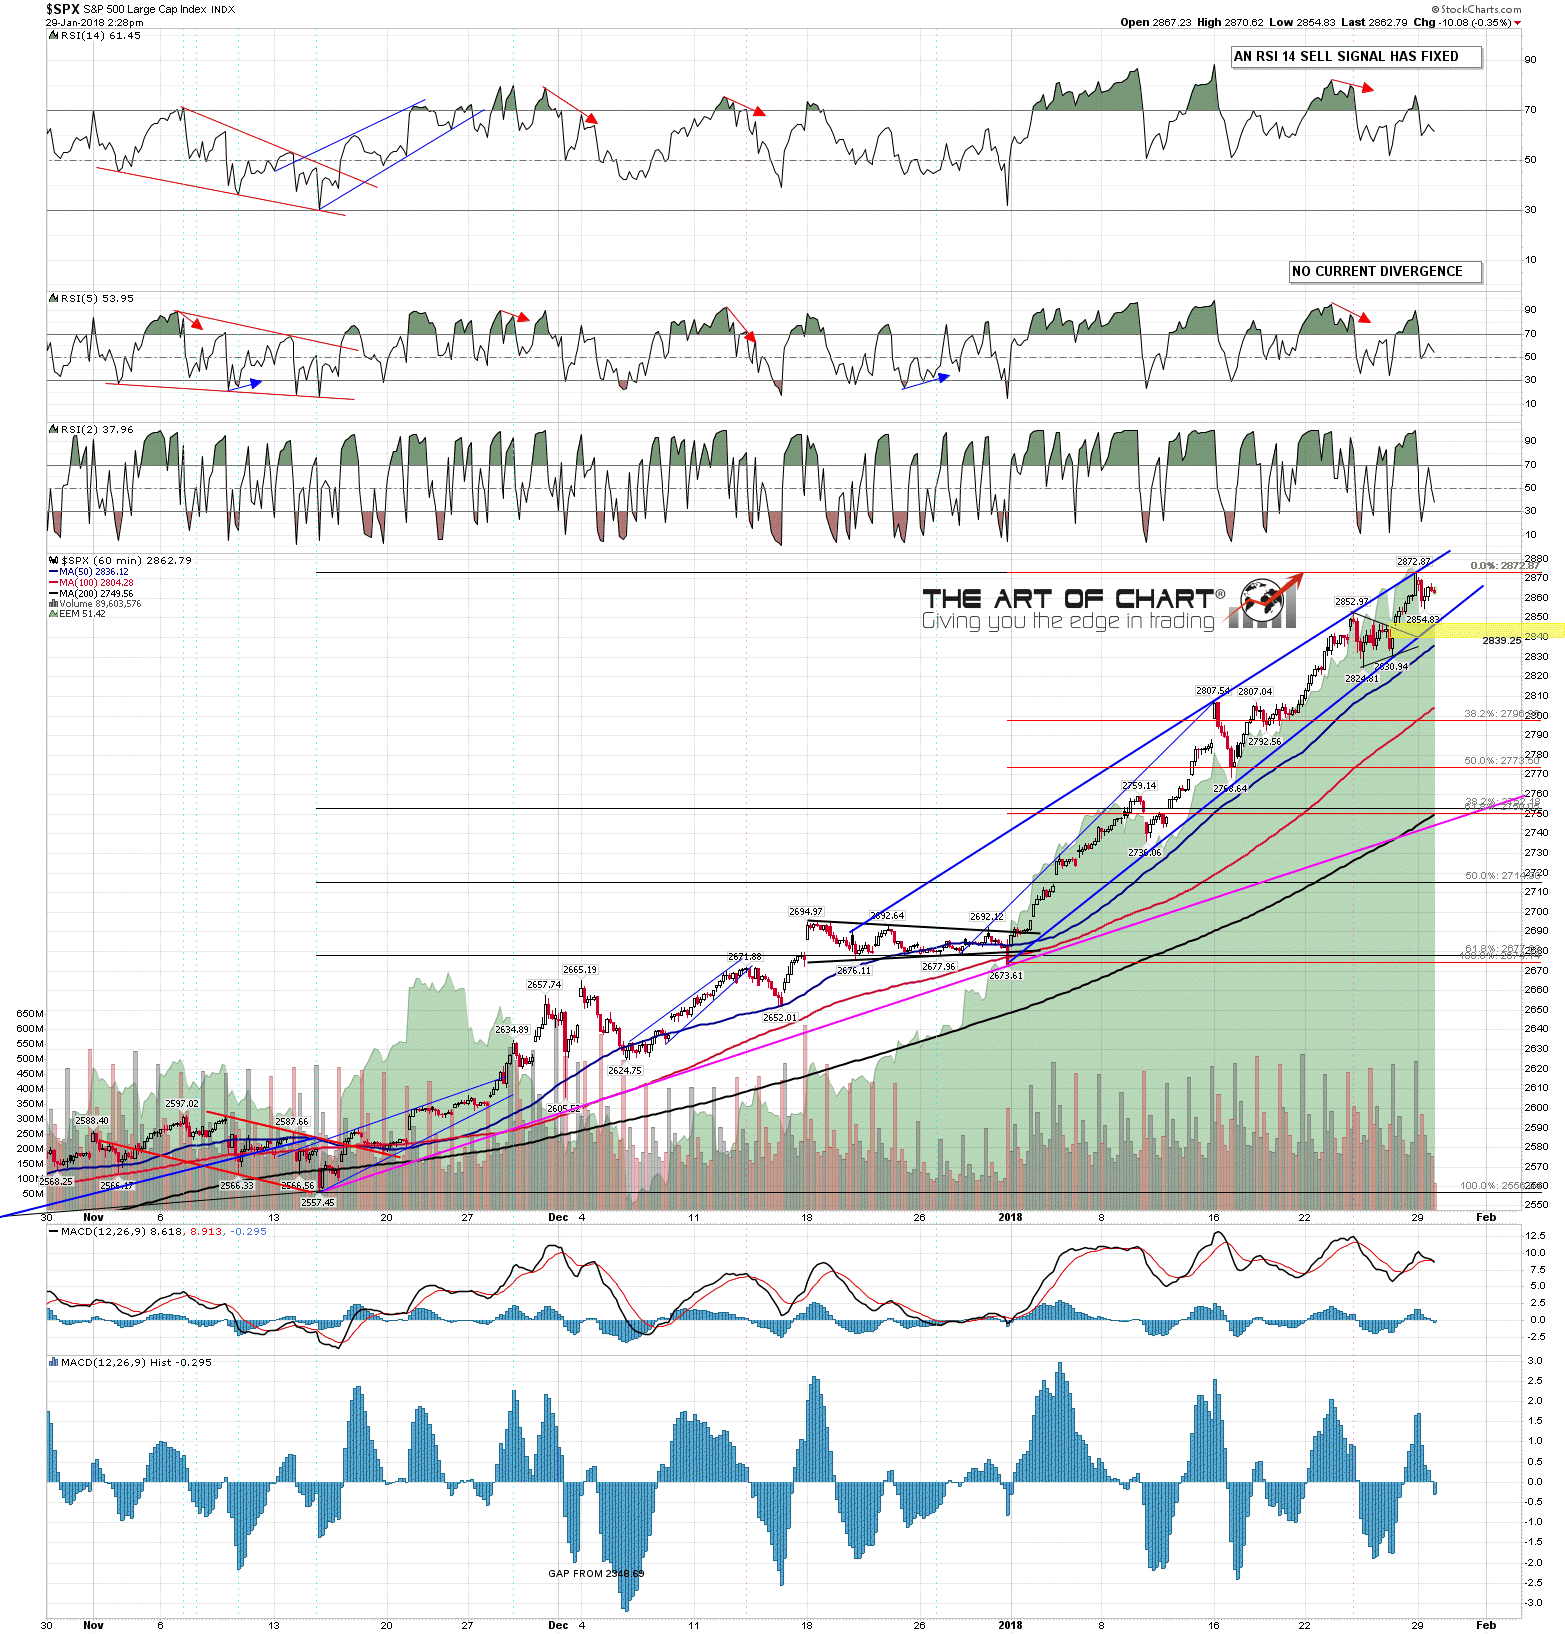
How does this setup look on SPX? Well the first thing to note is that trendline resistance on SPX was hit at the high on Friday, and that may mean that trendline support, currently in the 2848 area needs to be tested before any higher high. That would mean a test of the ES weekly pivot if seen today or earlyish tomorrow. The bull/bear line on SPX is a little lower though, with that trendline support first, but clear backup support at the open breakaway gap from 2839.25. If that gap gets filled then the triangle thrust will have been fully retraced and, if these triangles were termination patterns (usually but not always), then a significant swing high should be in. SPX 60min chart: