
Stan and I are doing our free monthly Chart Chat on Sunday at theartofchart.net. We’ll be covering the usual wide range of instruments and you can register for that on our February Free Webinars page.
No futures charts or video this afternoon as I tripped over this morning while trying to find somewhere in an unfamiliar city using Google Maps. My phone smashed and that, needless to say, is my primary authentication device for accessing my futures charts.
Only a temporary setback as I have a very good iPhone/iPad repair place, and I am a favorite customer with a bulk discount due to my household having a lot of apple devices, mainly being used by three rather careless/clumsy kids. I’ll have the iPhone back tomorrow so I’m inclined to interpret this as a sign from above suggesting that I might consider going to bed early tonight. For a fact, I am rather tired so I think I’ll be doing that.
On to the markets then, going old school with no futures charts due to my morning mishap, and may I just say how delighted I am to see the bloodbath on the equity indices today. This was what I was hoping for when the termination triangles on SPX and NDX were spiking up a week ago. If we saw a sharp retracement from those triangle highs then we might well be watching the start of a two way market returning on equities, and those are a lot more interesting than one way markets. So where are we now on SPX, NDX and RUT?
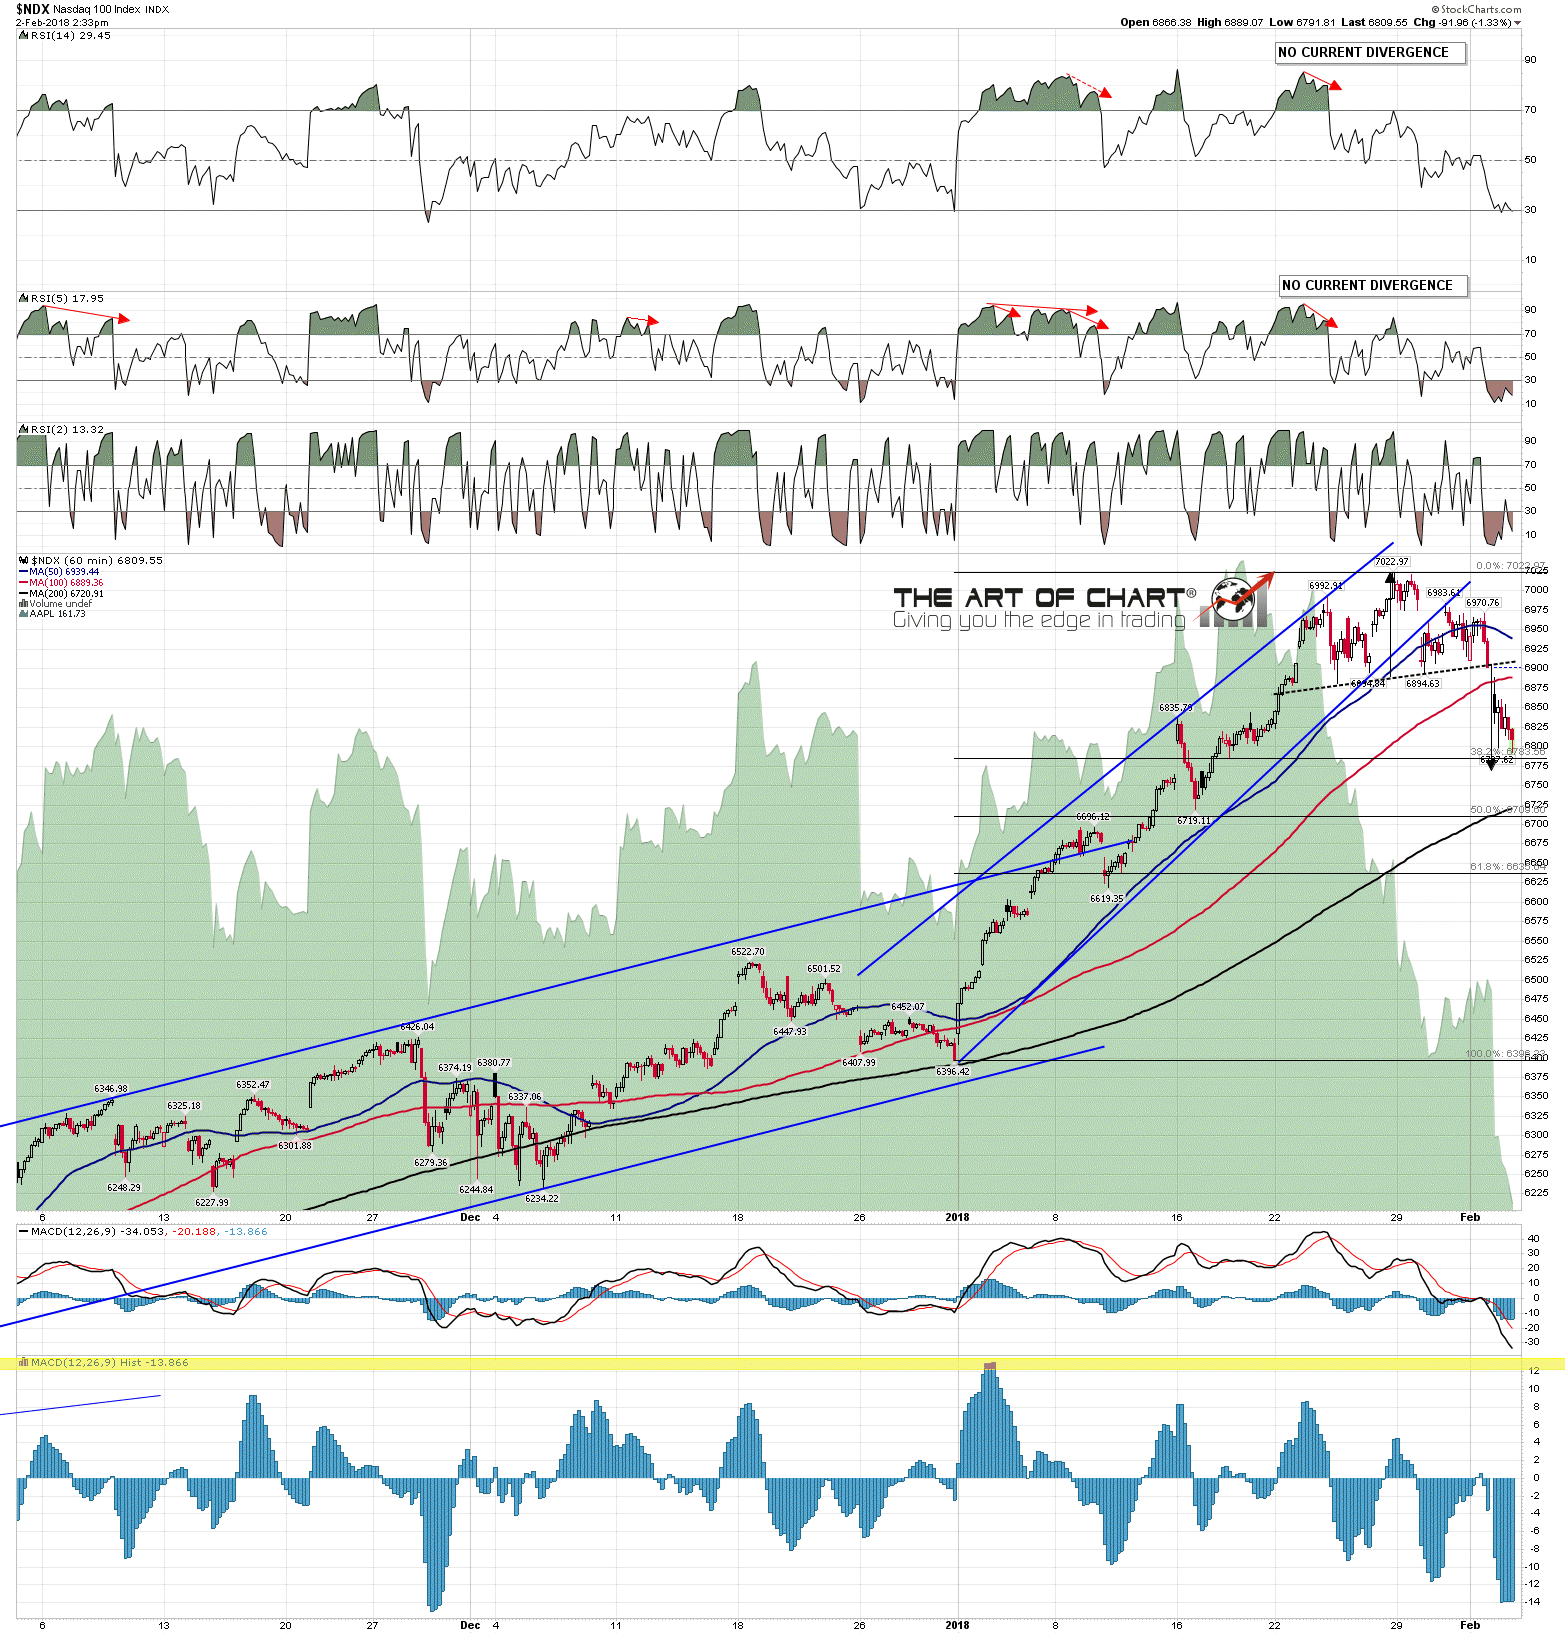
I showed the H&S on NDX in my post yesterday. Obviously that has broken down hard and is close to the target in the 6775 area. That will likely be reached today. NDX 60min chart:
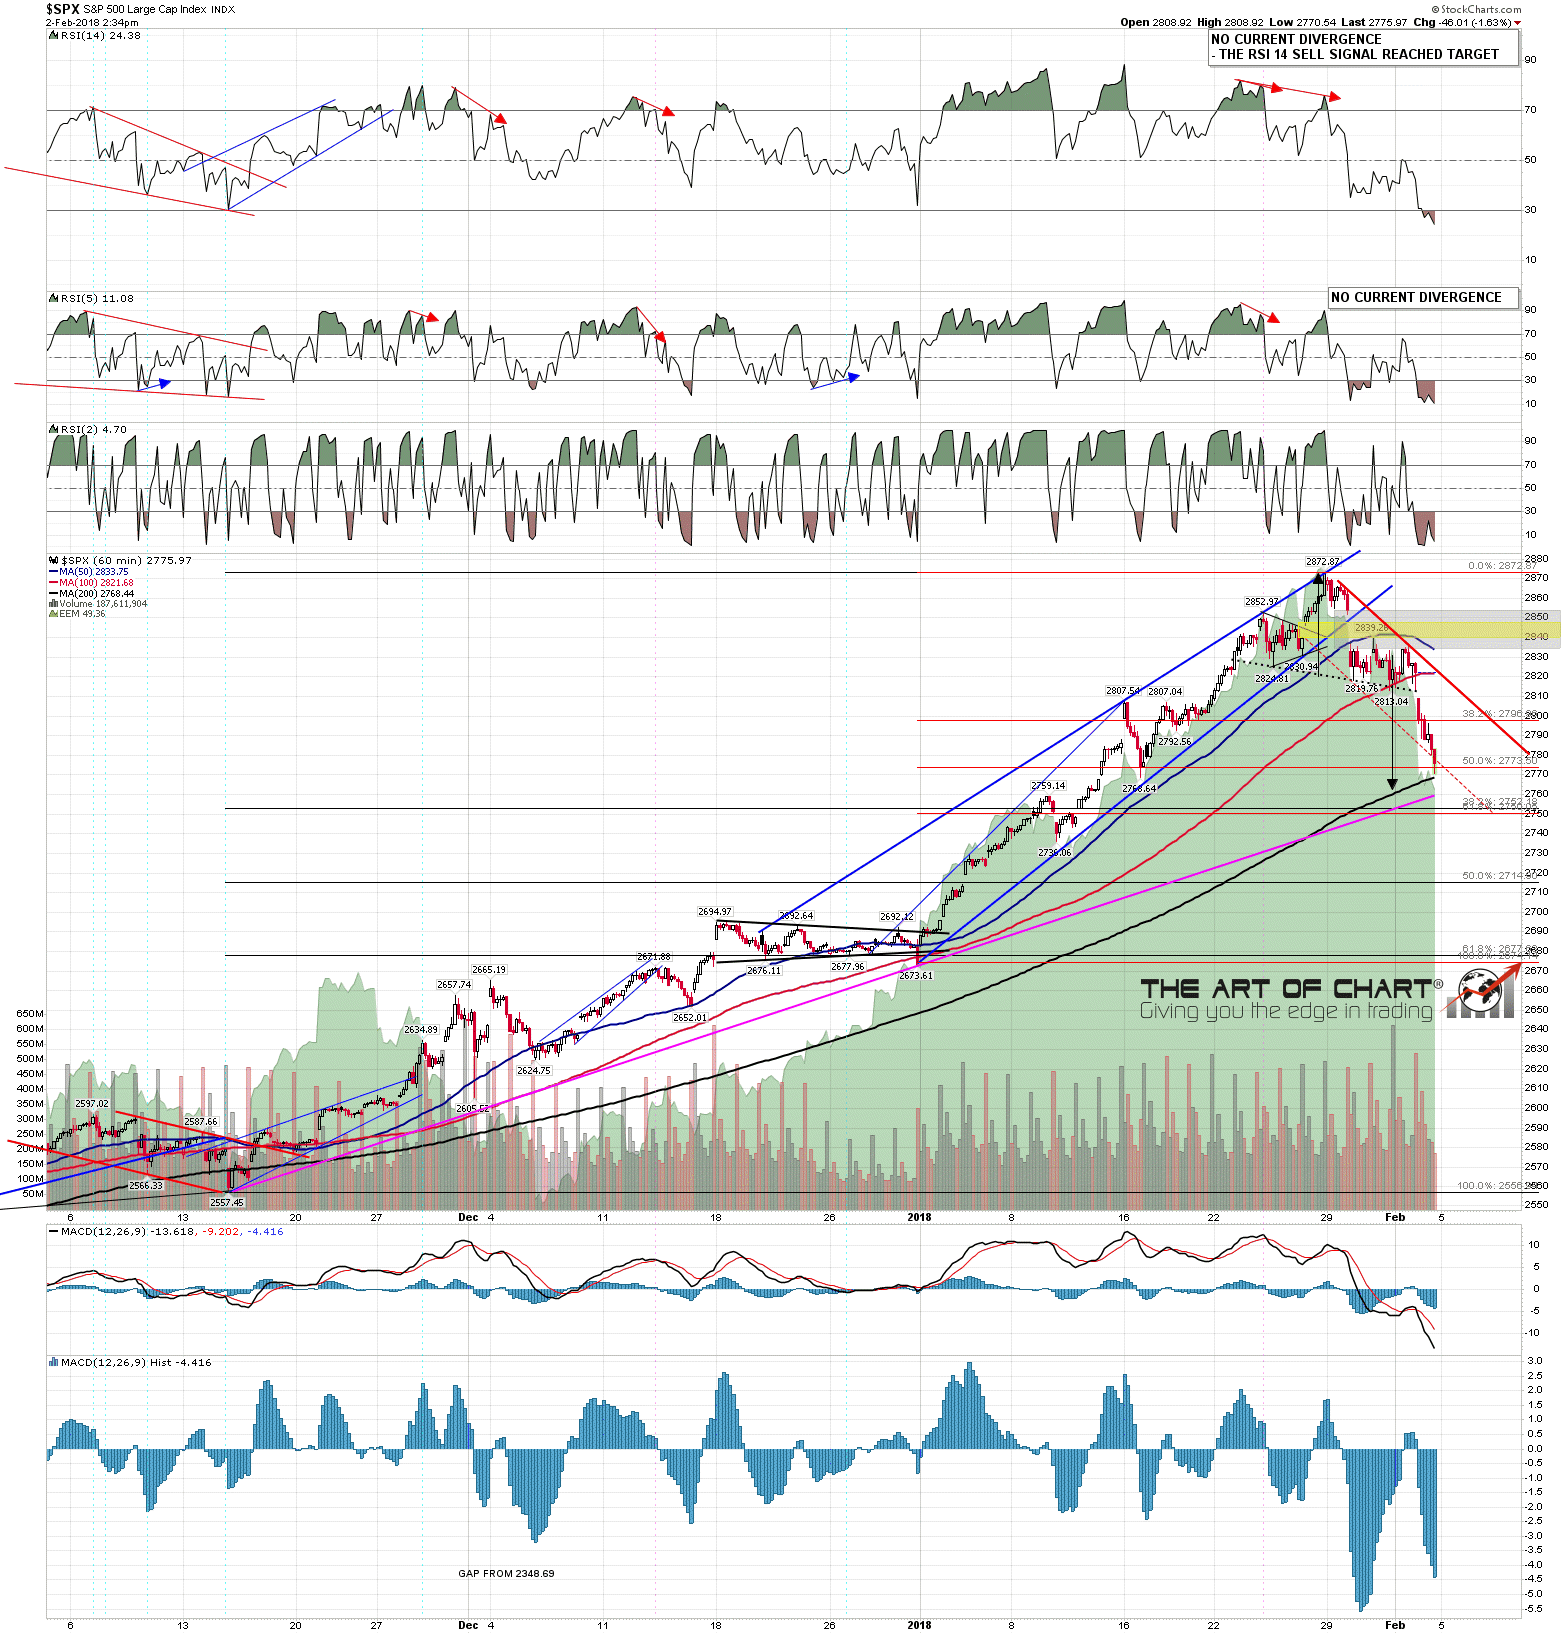
There is a less high quality H&S on SPX with a target in the 2762 area and that target has been reached as I have been writing this. SPX 60min chart:
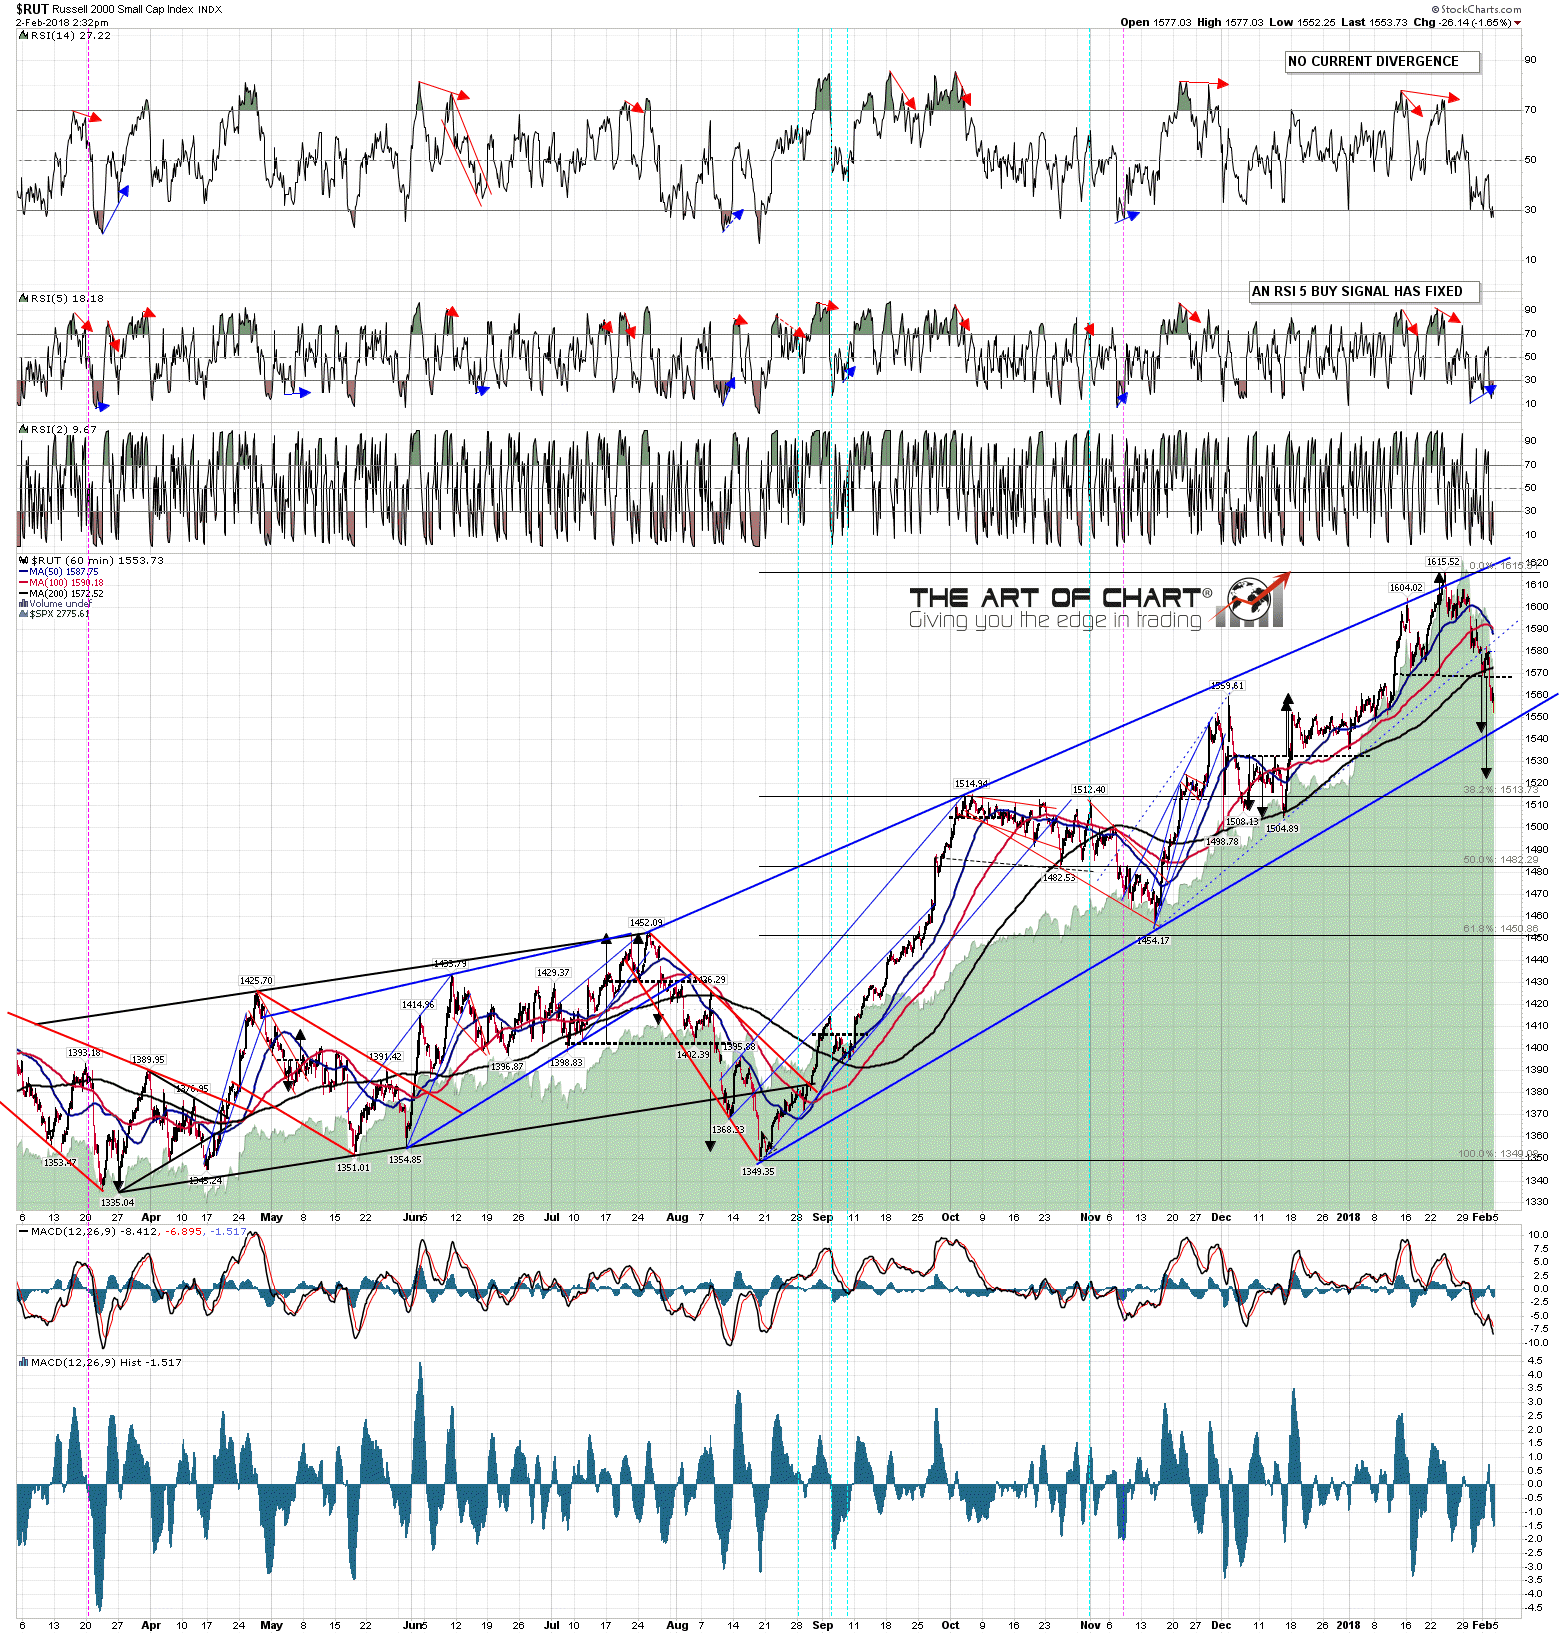
On RUT the H&S is low quality, and the main target that I am watching is the rising wedge support trendline from the August low, currently in the 1544 area. If that breaks then the low quality H&S target would be in the 1522 area. That trendline in the 1544 area is strong support however and may hold. RUT 60min chart:
I’m hoping to see at least a 5% retracement on SPX from last week’s ATH to this retracement low, just to show that this may be returning to two way trade status. That would need a retracement low under 2729.22. We’ll see whether I get it. Everyone have a great weekend. 🙂
