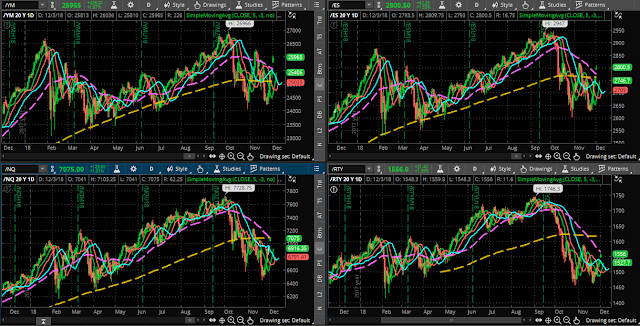
As I’m writing this on Sunday around 7:30 pm ET, the four U.S. E-mini Futures indices have gapped up and are currently trading above a “chaos zone” of a trio of future-offset 5, 8 & 13 moving averages (green, red & blue), as shown on the following daily charts of the YM, ES, NQ and RTY.
Both the YM and ES are above the 50 MA (pink) and 200 MA (yellow). Both the NQ and RTY are trading under the bearish influence of a moving average Death Cross formation. The NQ is slightly above its 50 MA, but slightly below the 200 MA, whereas the RTY is below both of those.
On a short-term basis, I’ll be looking for price on all four E-minis to hold above, firstly the moving average trio and, secondly, their 50 MA to maintain a bullish bias, whereby we may, potentially, see them retest their highs of this year or even set new records before year end (the RTY will have to first break above its 50 MA).
Price on the following SPX:VIX monthly ratio chart popped back above the 150 Bull/Bear Line-in-the-Sand level on Friday.
We’ll need to see it hold above 150 to corroborate a bullish bias and an advancement on the ES, as mentioned above.
Failure of the 4 E-minis and the SPX:VIX ratio to hold above these moving averages and price level, respectively, could see the SPX drop to 2400, as I recently described here.


