Slope of Hope Blog Posts

Slope initially began as a blog, so this is where most of the website’s content resides. Here we have tens of thousands of posts dating back over a decade. These are listed in reverse chronological order. Click on any category icon below to see posts tagged with that particular subject, or click on a word in the category cloud on the right side of the screen for more specific choices.

Chock-a-Block

By -

This is a self-indulgent post, because I just upgraded our platform to an editor that uses a much, much fancier approach to creating posts.

  • It’s gluten-free
  • It’s carbon-neutral
  • It’s wholesome and organic

In any case, I am watching with great interest what’s going on with futures right now. The “2620” number I kept yammering on about has been broken, as of this moment, and I certainly hope to wake up to plenty of red.

In the meanwhile, I’m going to return to my Glenlivet and the draft of my new book (and, please, I don’t need any more proofreaders; bless you all for volunteering, but goodness gracious I’ve got a lot of volunteers already).

Gold Stocks Acting as They Should During Market Stress

By -

The macro has moved through a time of moderately rising inflationary concerns when economies were cycling up, many commodities were firm and risk was ‘on’. Contrary to the views of inflation-oriented gold bugs, that was not the time to buy gold stocks.

As I have belabored again and again, the right time is when the inflation view is on the outs, gold is rising vs. stock markets, the economy is in question, risks of a steepening yield curve take center stage (the flattening is so mature now that steepening will be a clear and present risk moving forward) and by extension of all of those conditions, confidence declines.

Well?…

(more…)

How Now Dow Cow?

By -

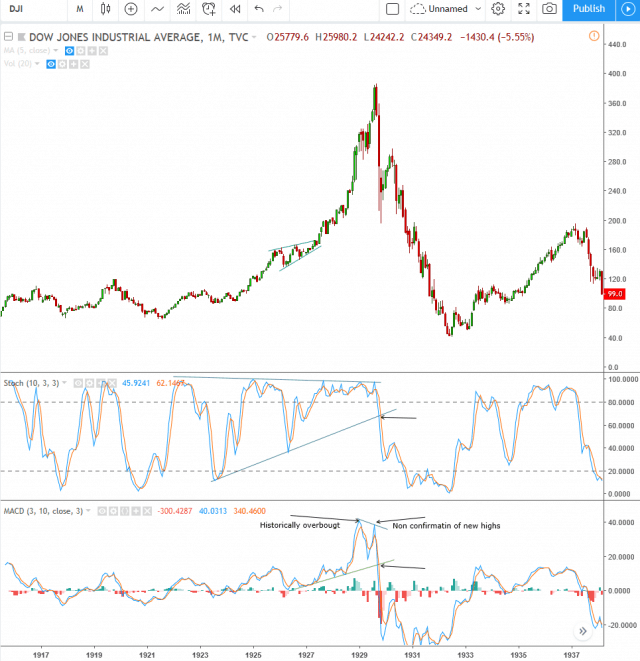
A reader recently shared with me some charts which I find remarkable. The point is a simple one, as is the presentation.

Below is a monthly chart of the Dow 30 Industrials. Take note of the two study panes beneath it: the top is the stochastics, and the bottom is the MACD. In particular, notice the line markups on the indicators showing the pattern breaktop (stochastics) and the non-confirmation divergence (MACD). Click on the chart to see a bigger version.

DowDepression (more…)