Slope initially began as a blog, so this is where most of the website’s content resides. Here we have tens of thousands of posts dating back over a decade. These are listed in reverse chronological order. Click on any category icon below to see posts tagged with that particular subject, or click on a word in the category cloud on the right side of the screen for more specific choices.
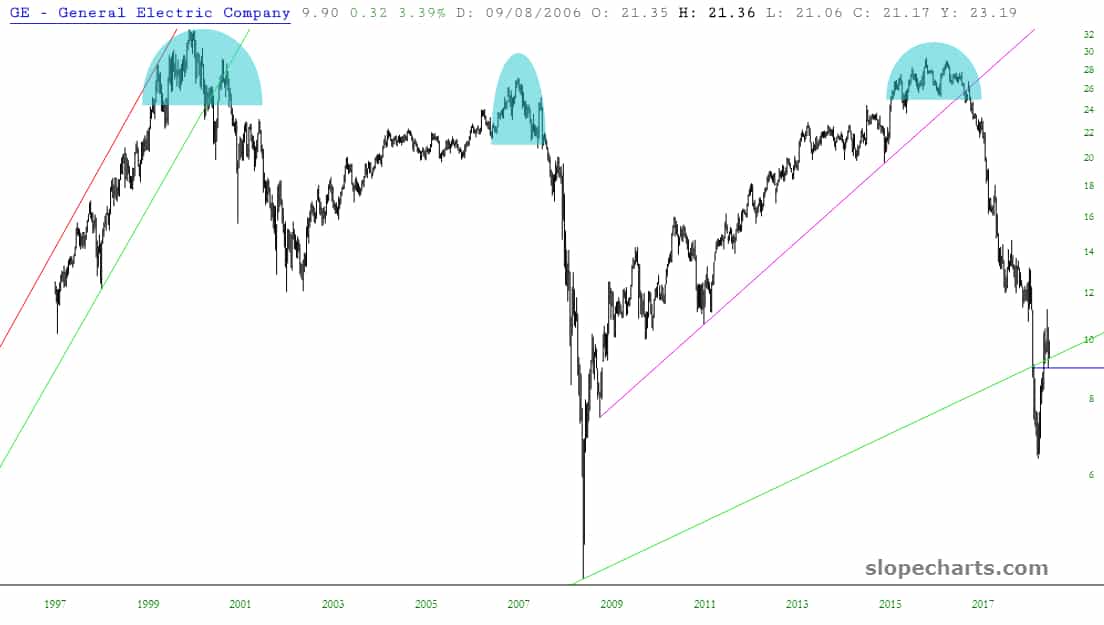
Here’s a long idea which is a pretty odd one, even for me, but I’ll offer it up anyway: General Electric. First, take a very long-term view of this battered critter. Pay particular attention to the fact that it seems to have found some support on that lowest trendline, which it briefly broke.
The market has been going pretty much vertical since Friday, and today’s rally is a little mysterious. As far as I can tell, there’s no news – – none – – to explain the push higher (unless one thinks that President’s declaration that he’d be OK doing away with “spring forward/fall back” every year is bullish).
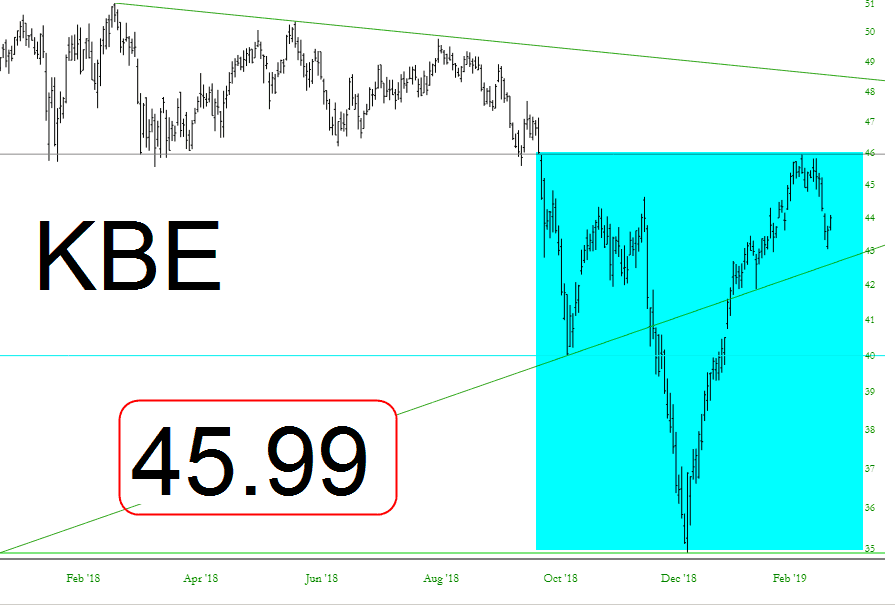
I think it’s useful to maintain a bit of paranoia about what could happen. Let’s focus on financials. I’d say there are two important lines in the sand to watch with the ETFs below. The first, the S&P bank ETF symbol KBE, has a neckline at 45.99 (if you’re having any trouble making out the tiny digits I’ve put on the chart below). That neckline constitutes the completion of an inverted H&S pattern which, in that instance, would send the price flying toward the green trendline.
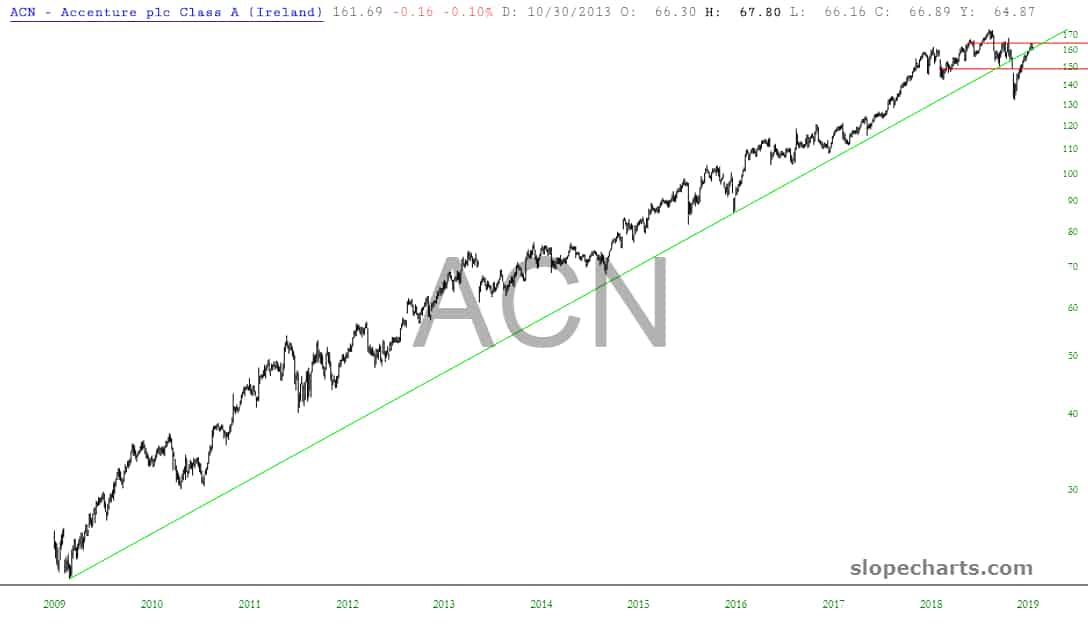
I’m short a lot of stocks right now, but I wanted to share with you a specific subset of them that have two common properties: (a) they have all failed very long-term ascending trendlines (b) they all have very clean tops.
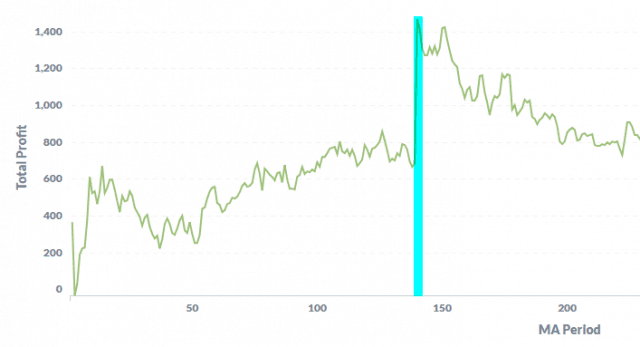
We’ve got something very cool brewing in the Slope of Hope laboratory. I’m not going to go too deeply into it, but suffice it to say we are doing some serious number-crunching to tease out optimal parameters for SlopeRules.