By using the shared indicator feature in SlopeCharts, I was able discover an interesting signal that just took place with the Russell 2000. Behold:
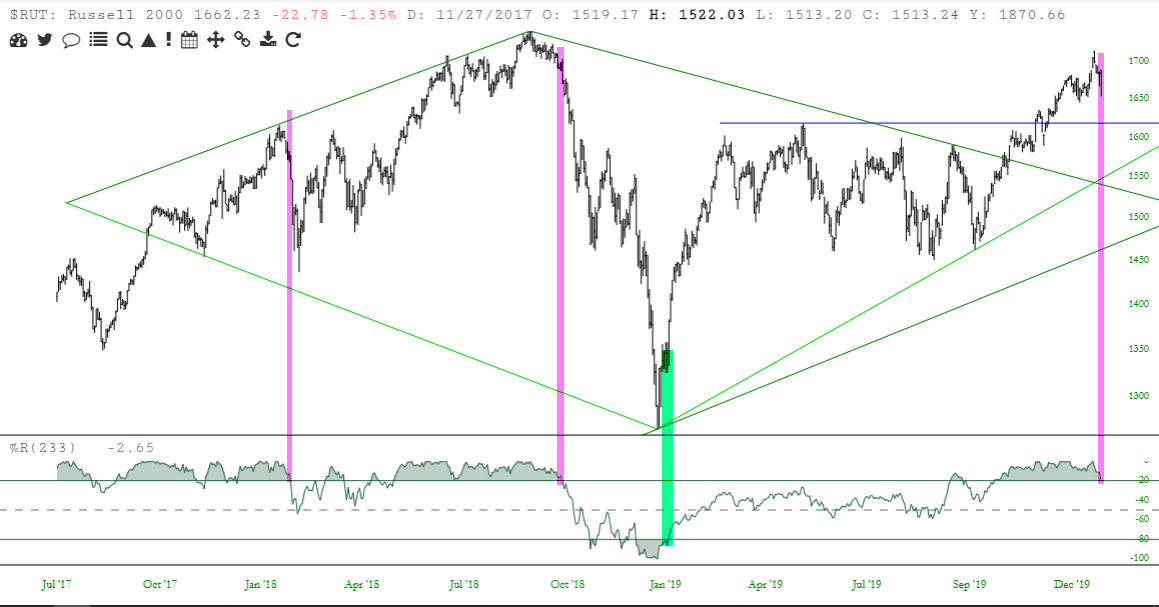
What the above chart displays is the valuable signal that the 233-day RSI provides. There are three short instances and one long instance. The most recent short instance is, well, right now, but in the prior three cases (again, 1 long, 2 short) they met with reasonable success.
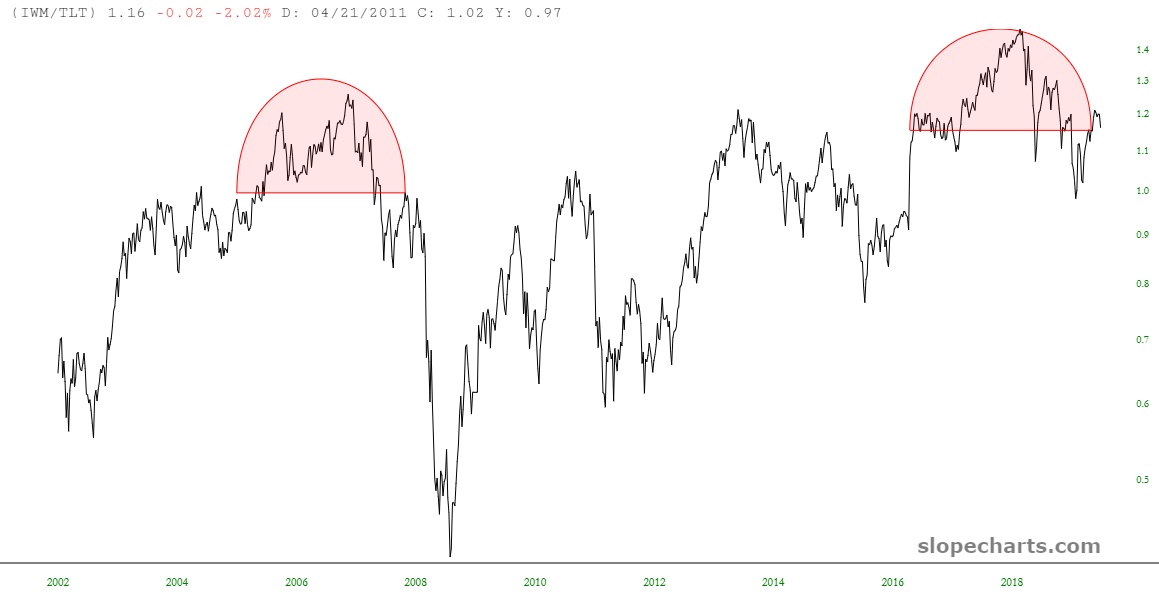
I would also point out this new ratio chart I created, which is the IWM divided by the TLT (pretty spiffy, eh?) It suggests a continuation of my “lower stocks, higher bonds” disposition. Yer welcome.