
On Friday afternoon. in the webinar I posted on my twitter, I was talking about the either way setup that had formed on equity indices with the formation and break down from head and shoulders patterns on SPX, NDX, RUT and INDU. I noted that on this setup there were only two strong targets to watch, and that was either a move to the H&S target, on SPX a retracement to the May low at 2766, or a rejection back up into a retest of the June high. In the case of the rejection that would be a pattern that I would call a Janus (Bull) Flag, I see a lot of these and they make the rejection/retest target 80% to 90% of the time. When the target isn’t reached there is often a near miss.
The H&S patterns have since all failed, so the Janus Flag targets are fixed on all of those indices and in the absence of strong evidence to the contrary, I’m expecting those targets to be reached.SPX 60min chart:
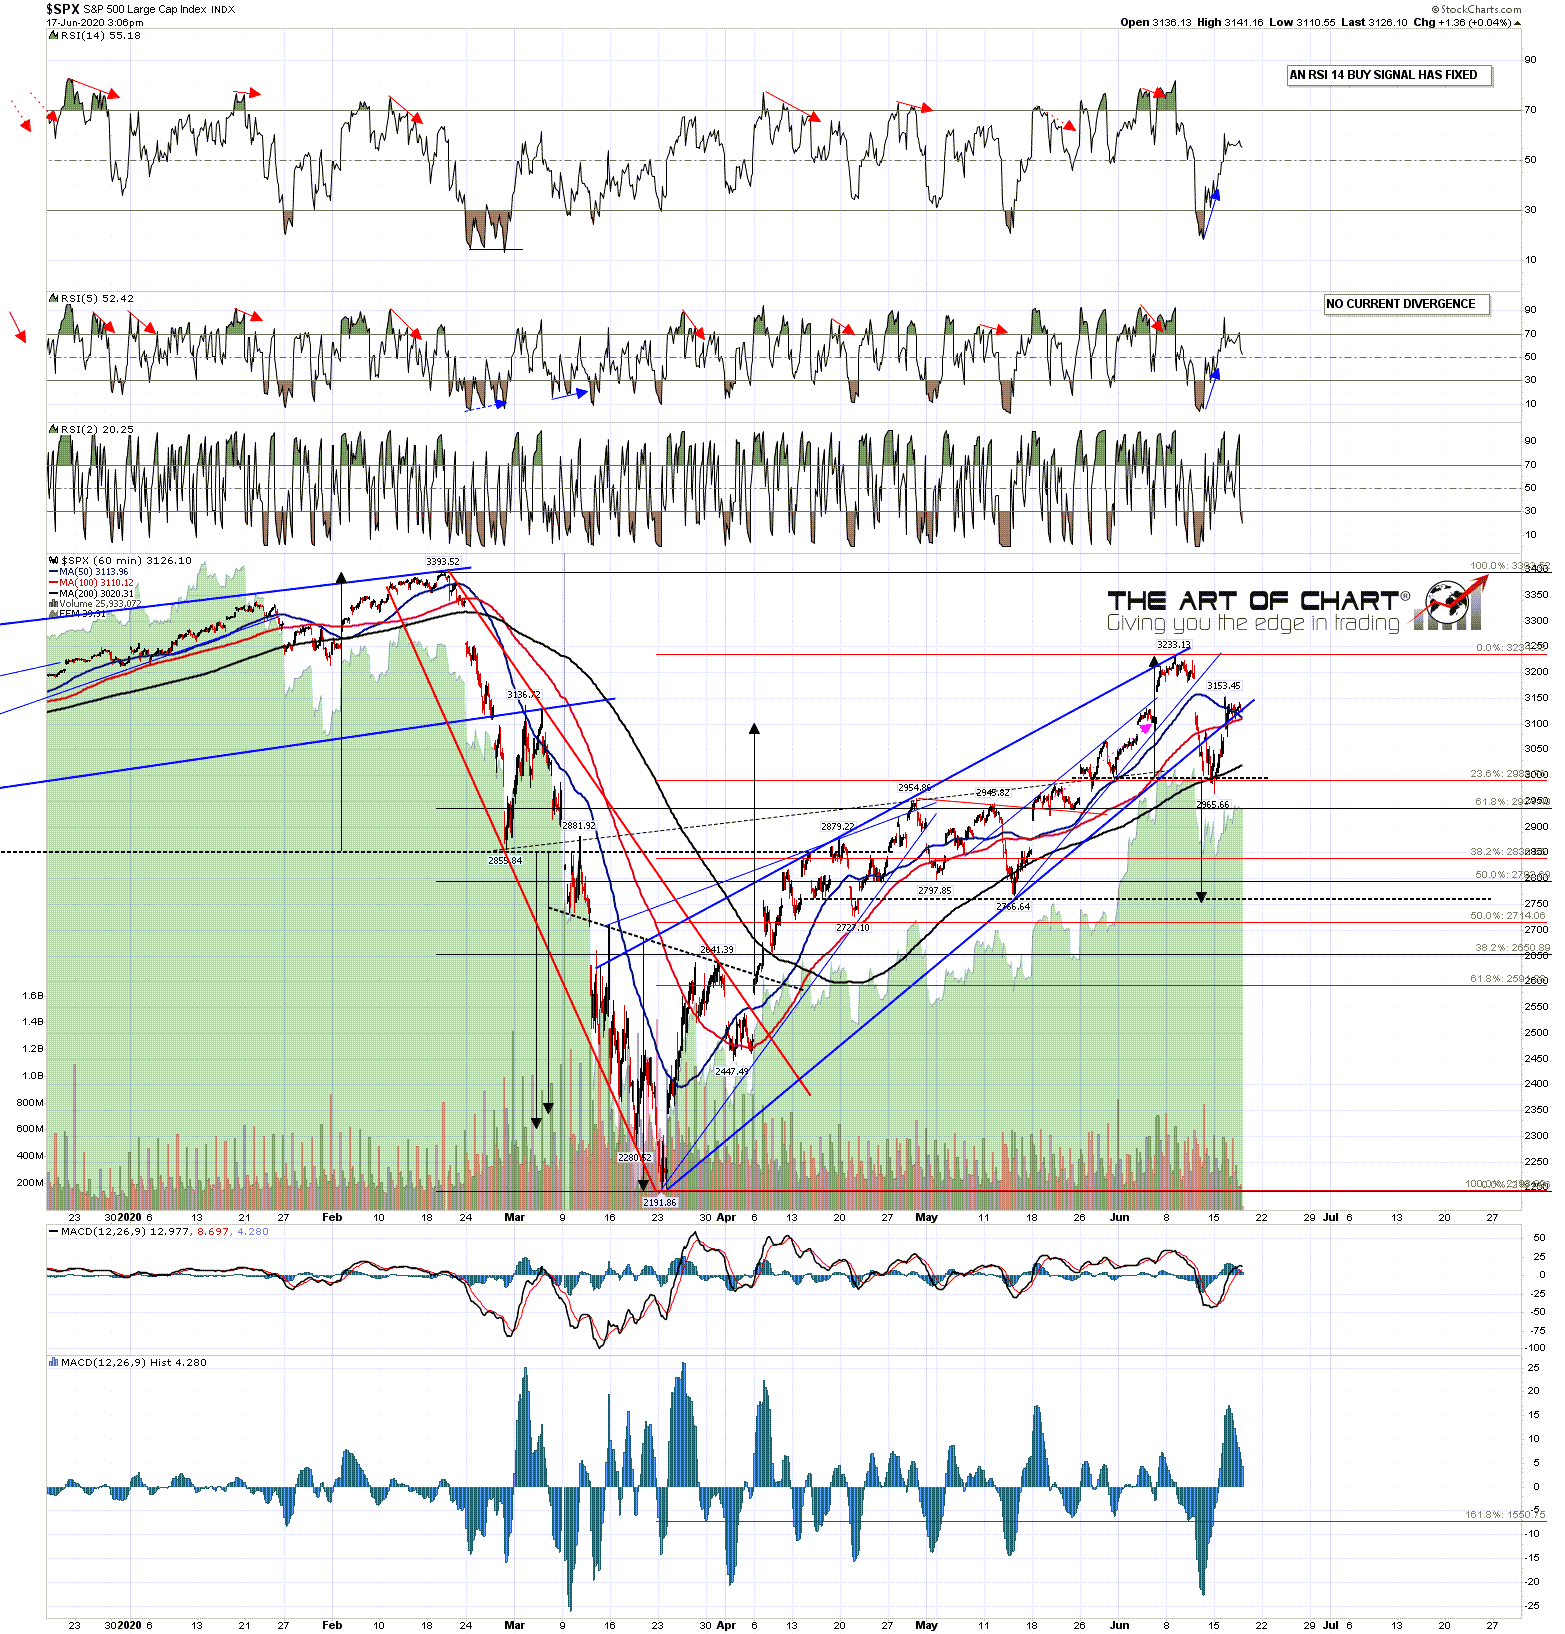
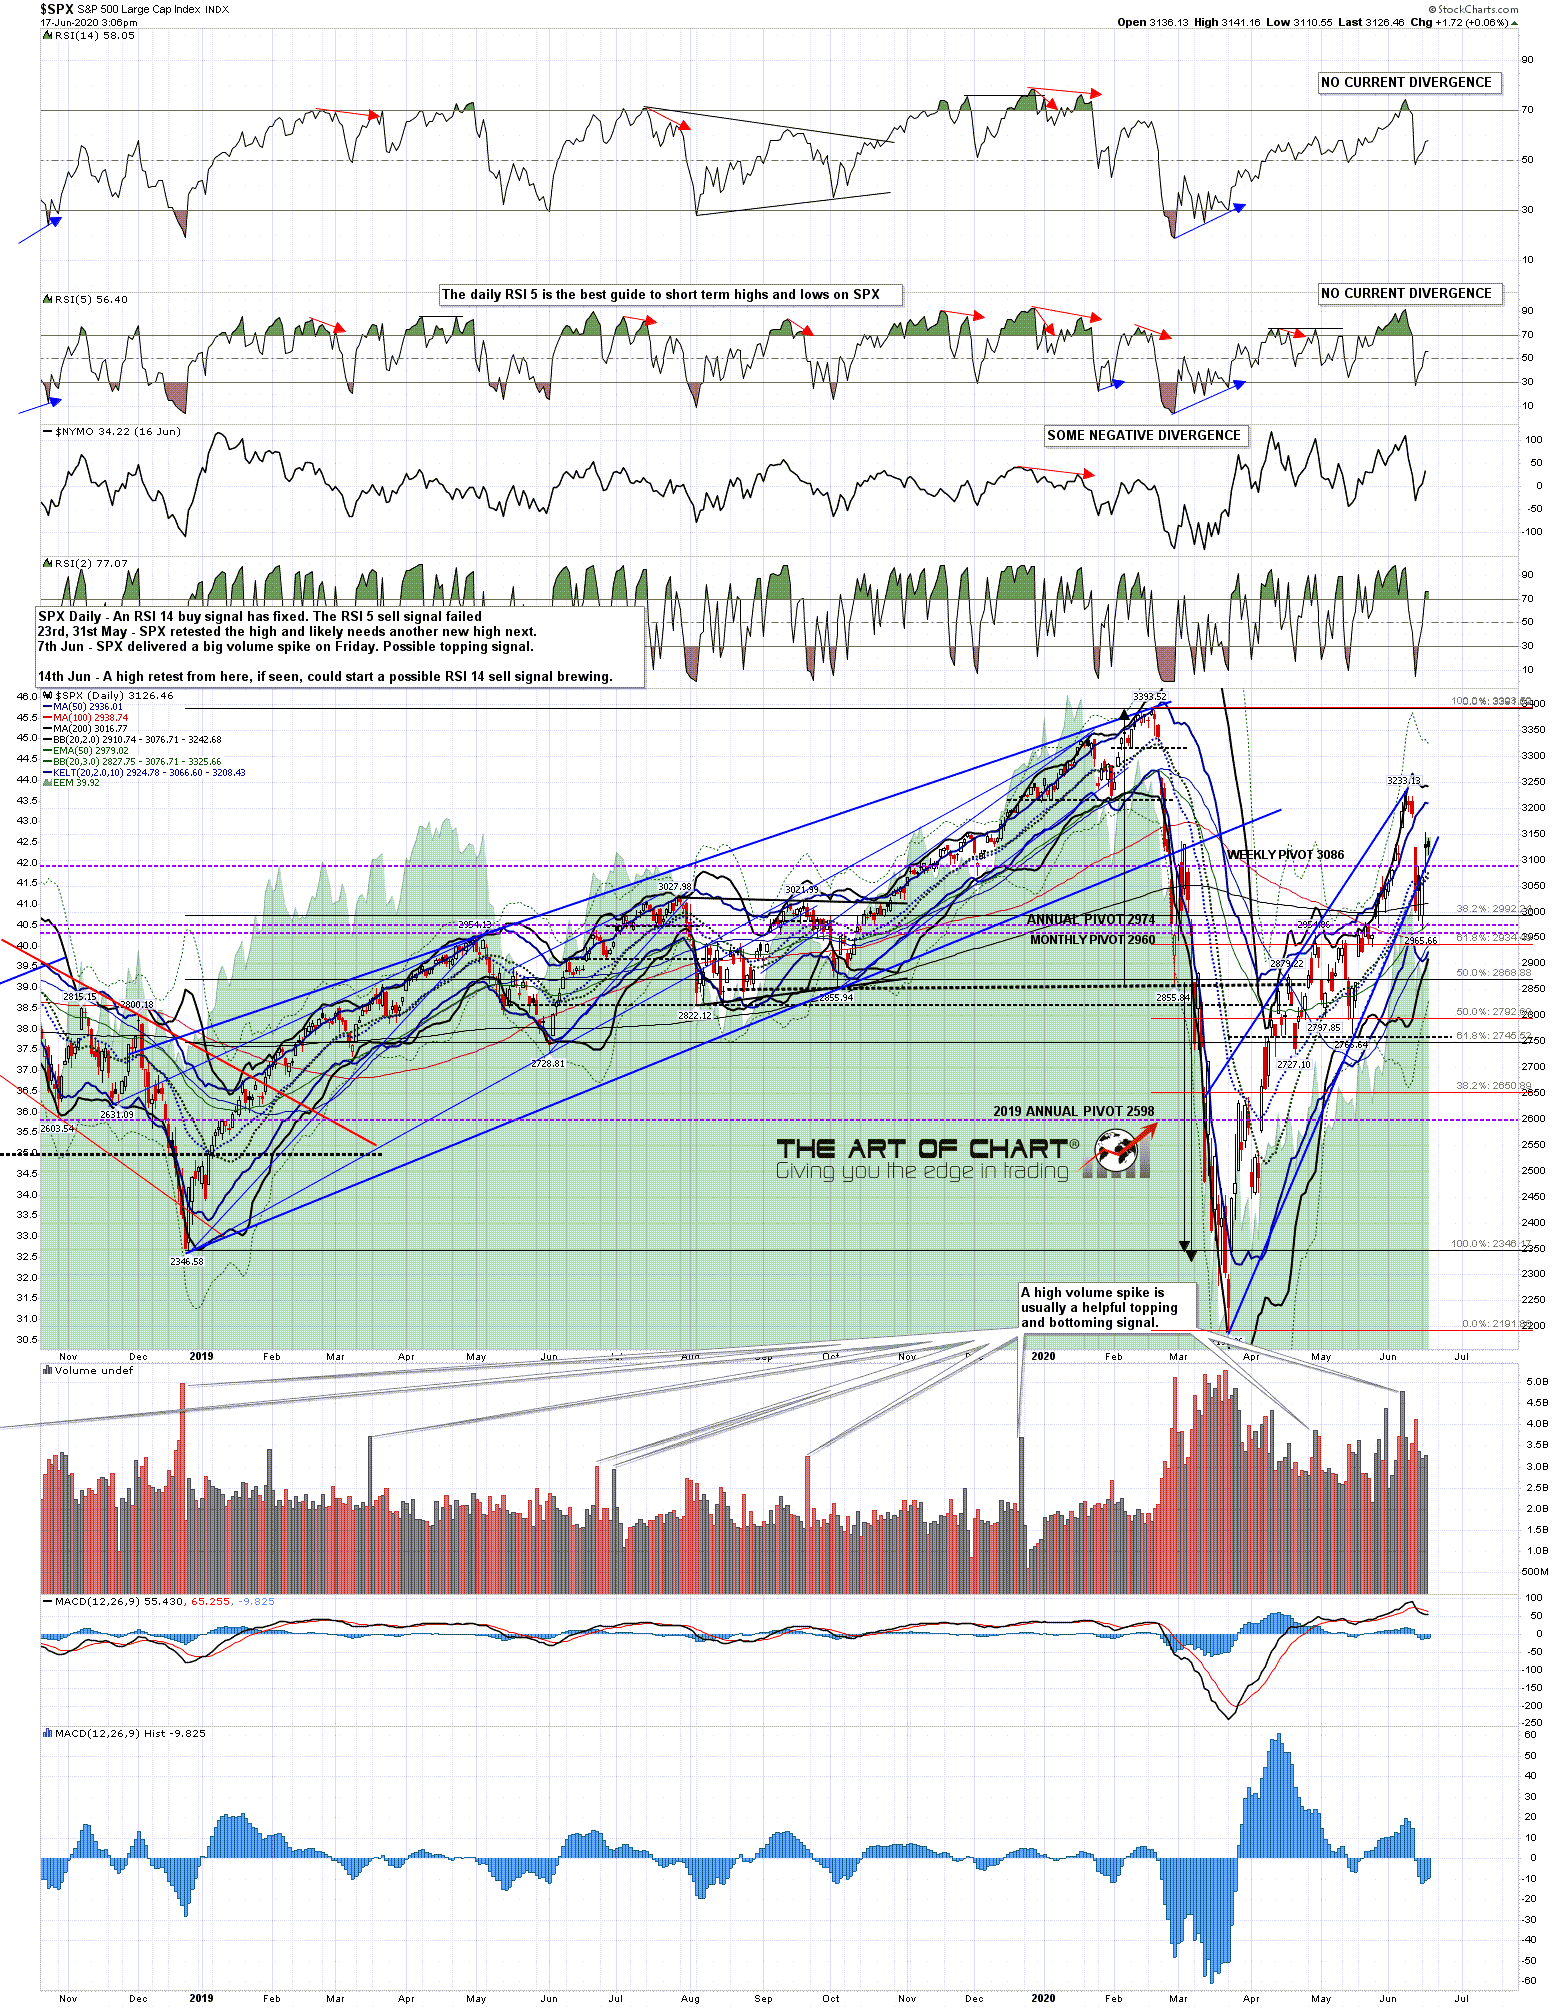
On the SPX daily chart the close on Friday was a close just under the daily middle band that confirmed the close below on Thursday, but since then the close back above the daily middle band on Monday and confirming close above yesterday have re-established the daily middle band, currently at 3077, as support. SPX is currently breaking and trying to convert the next big level at the 50 hour MA, currently in the 3116 area, to support. A conversion of this level to support should open a retest of the June high. The upside is supported by an hourly RSI 14 buy signal that is still some distance short of the target level at 70 on the SPX hourly RSI 14. SPX daily chart:
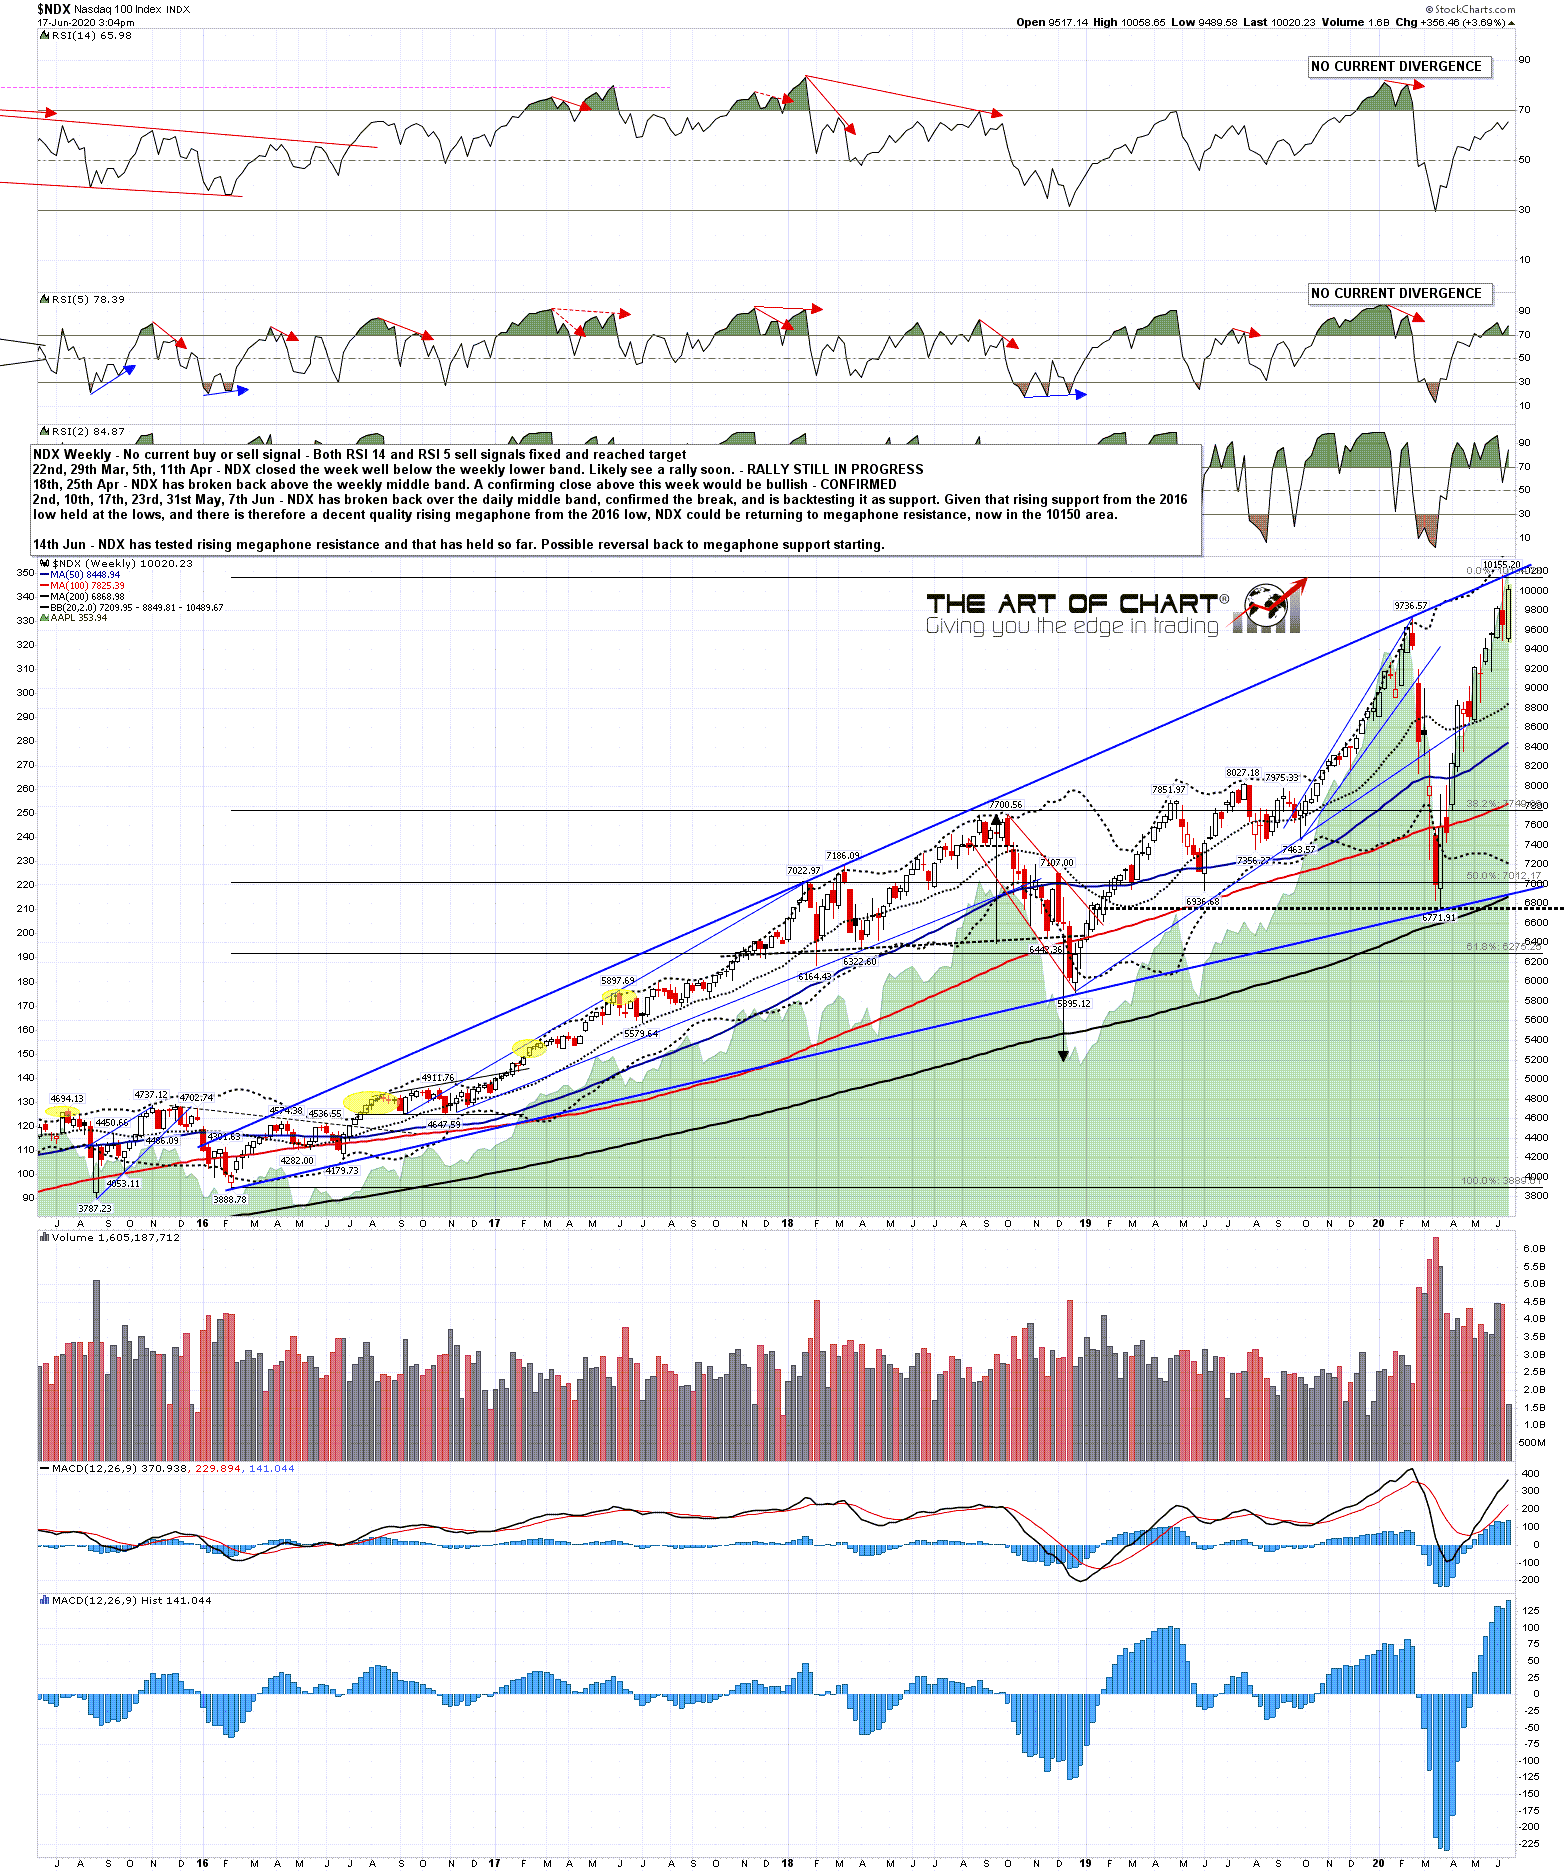
There is a potential bump in the road though, and that is that NDX has been considerably outpacing the other indices on the way back to the high retest. That is a potential issue because main rising megaphone resistance on NDX is only just above the June high. If NDX makes the Janus Flag target at the retest of the June high, and then reverses at that trendline then the other indices might not make their high retests. Given that the pattern is a rising megaphone though NDX might go through the trendline in a bearish overthrow that would allow all the targets to be reached. Either way, if NDX turns back towards rising megaphone support, then that is currently in the 6950 area. If there is a bearish overthrow of megaphone resistance first then I’d expect that megaphone support to be broken. NDX weekly chart:
We’ll see how that goes and if Powell can avoid any market boosting or busting public statements for a couple of days then we might even see those retests this week. A couple of announcements today. An hour after the close tomorrow Stan and I will be doing our monthly free public webinar at theartofchart.net looking at the big five stocks and key sectors. Tickers covered will be the usual AAPL, AMZN, GOOG, FB, NFLX, TSLA, IBB, IYR, XLE, XLF, XLK and XRT. If you’d like to attend you can register for that here. We’ve also just launched our annual 4th of July sale on annual memberships at theartofchart.net and for the duration of the sale annual memberships can be bought for the price of eight months at the monthly rate rather than the usual ten months. If you are interested then you can find details about that here.
