There’s no doubt about it. Every rich person on the planet has become vastly richer thanks to the worldwide help of central bankers. As for everyone else – – hey, they got their stimmy checks, right?

Slope initially began as a blog, so this is where most of the website’s content resides. Here we have tens of thousands of posts dating back over a decade. These are listed in reverse chronological order. Click on any category icon below to see posts tagged with that particular subject, or click on a word in the category cloud on the right side of the screen for more specific choices.
There’s no doubt about it. Every rich person on the planet has become vastly richer thanks to the worldwide help of central bankers. As for everyone else – – hey, they got their stimmy checks, right?
For when it comes to trading the financial markets price is the ultimate arbiter of truth. Period. We can whinge and whine all we want about what the market ‘should be doing’ based on a laundry list of technical evidence suggesting that it is ‘overbought’. But in the end, the market will simply do what it wants to do. And when it wants to go up – we aim high – especially during a bull market.
So as you may recall from my previous update I keep seeing quite a few alarm signs flashing hot red, one in particular is excessive SKEW across SPX and SPY options. But then there’s this:
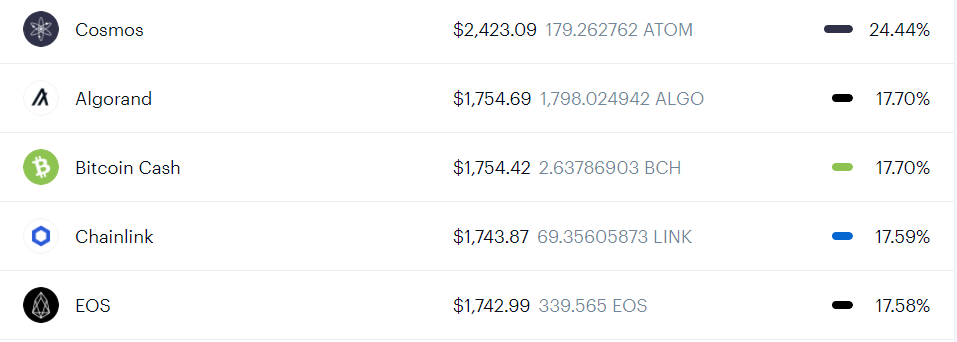
(more…)As a relative newcomer to the world of crypto, I remain flabbergasted at what a wretched experience it is for the user. The presentation of the information is straight out of a user interface guide from the year 1987. Coinbase, far and away the biggest force in the business, offers the following as its “Portfolio” (this is from my own account):
Courtesy of Elliott Wave International, and used with permission:
Why We Are Watching 2021
The April Elliott Wave Theorist is a rare video issue on the outlook for three key market sectors – stocks, commodities and interest rates. Editor Robert Prechter delivered this presentation on January 18, 2021. Interest rates have followed the script by rising sharply, and they have more to go. Commodities gained since that time as well. The current price action in the stock market makes now a good time to keep in mind our timing work in that sector.
We’re going to look at a 200-plus year chart of U.S. stocks prices. The data is the Dow Industrial Average going back to the 1880s. Prior to that, it’s data from different indexes that newspapers and other sources kept back in the 1800s.
(more…)