
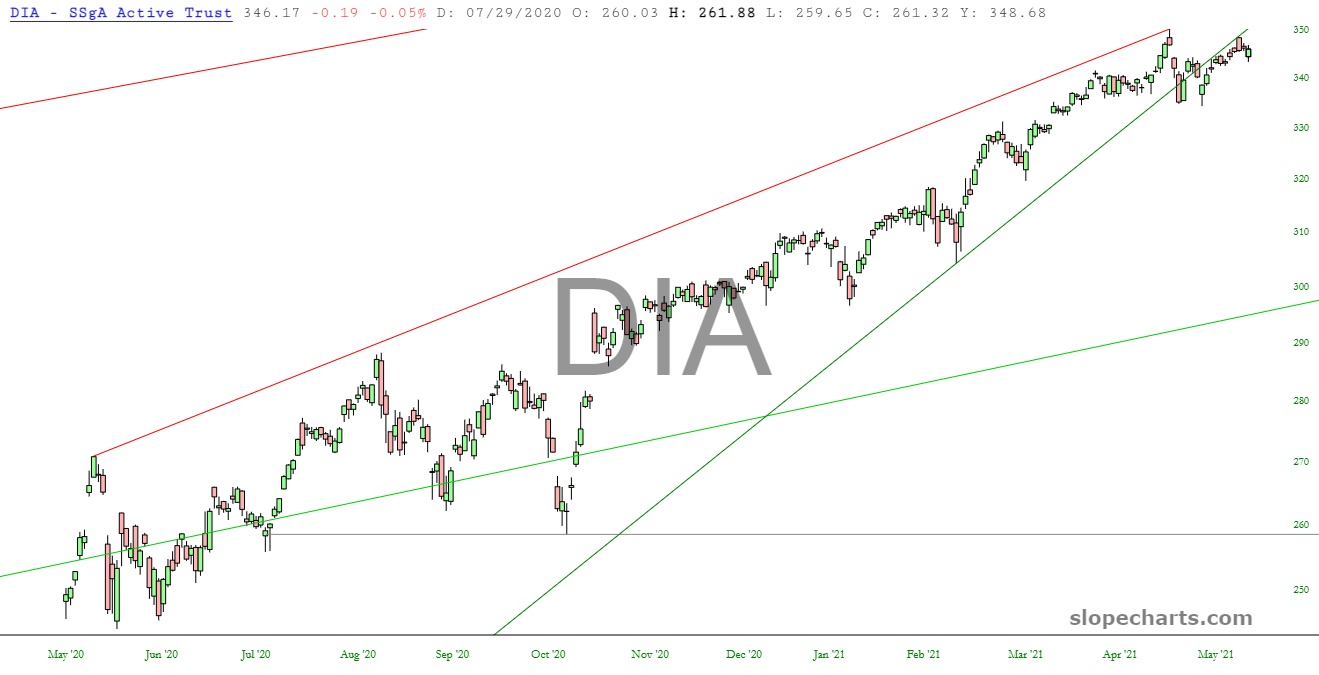
The market isn’t exactly bursting with excitement lately, so let’s take a pleasant stroll through ten up-to-date ETF charts and share a few words about each one. The first, the Dow 30 DIA, has broken its wedge.
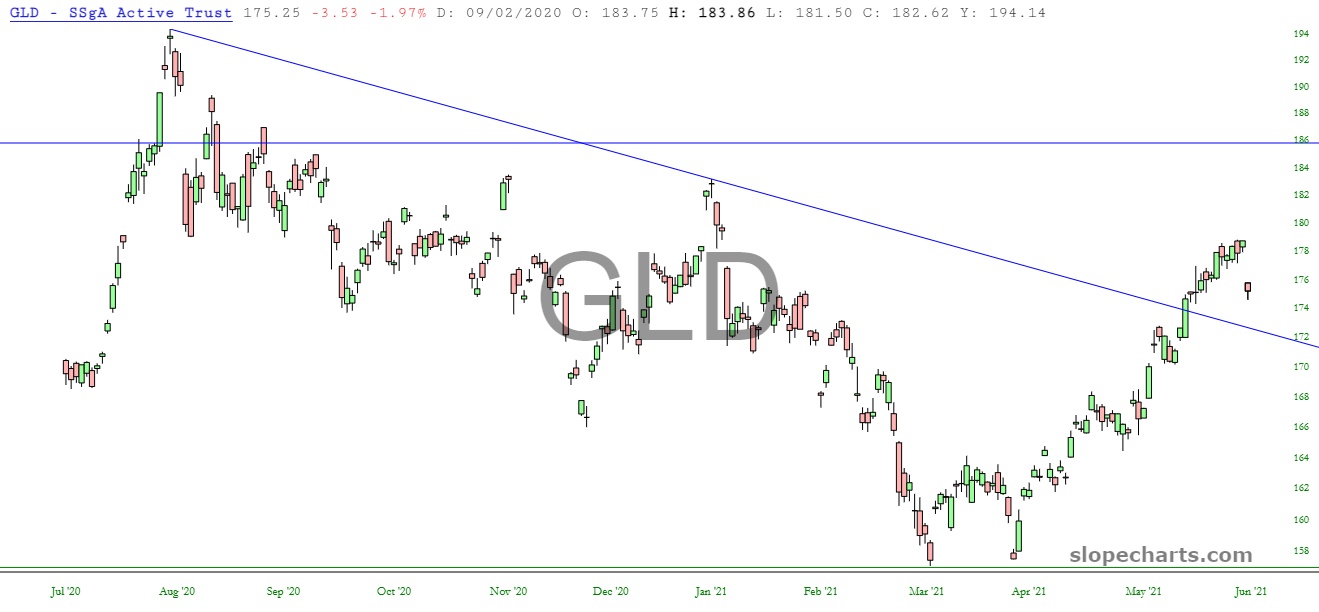
In contrast to this, gold push above its August 6 2020 trendline a couple of weeks ago. On Thursday, however, it gave back about a week’s worth of gains instantly. That trendline represents and important test of support now.
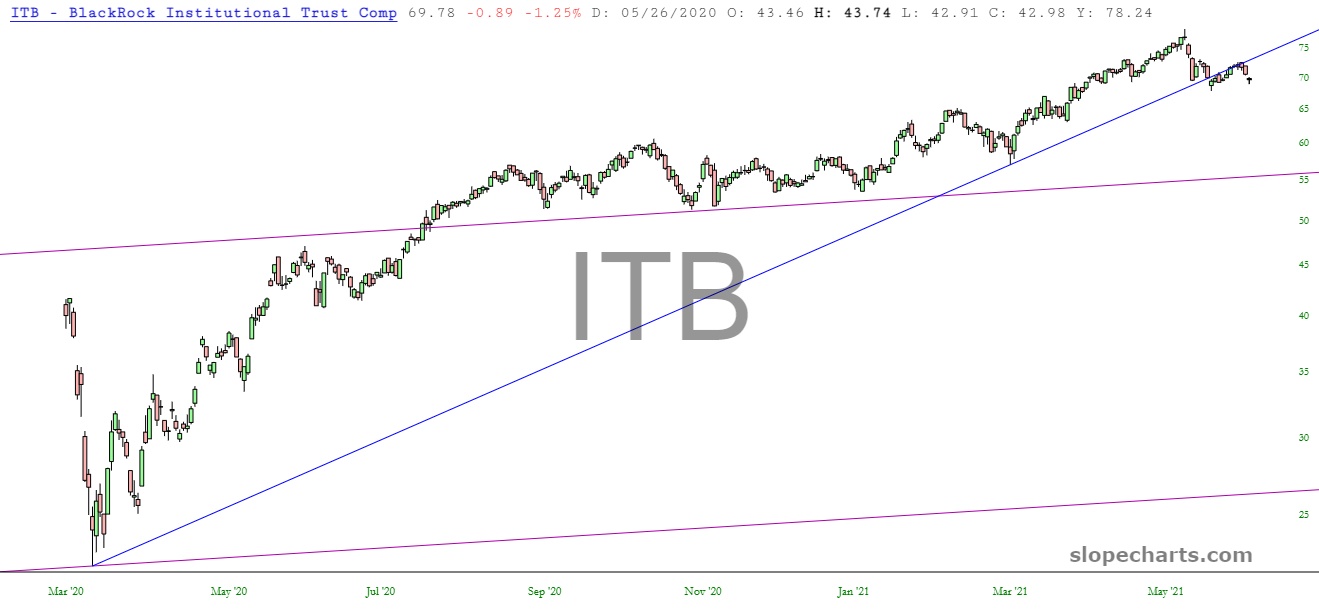
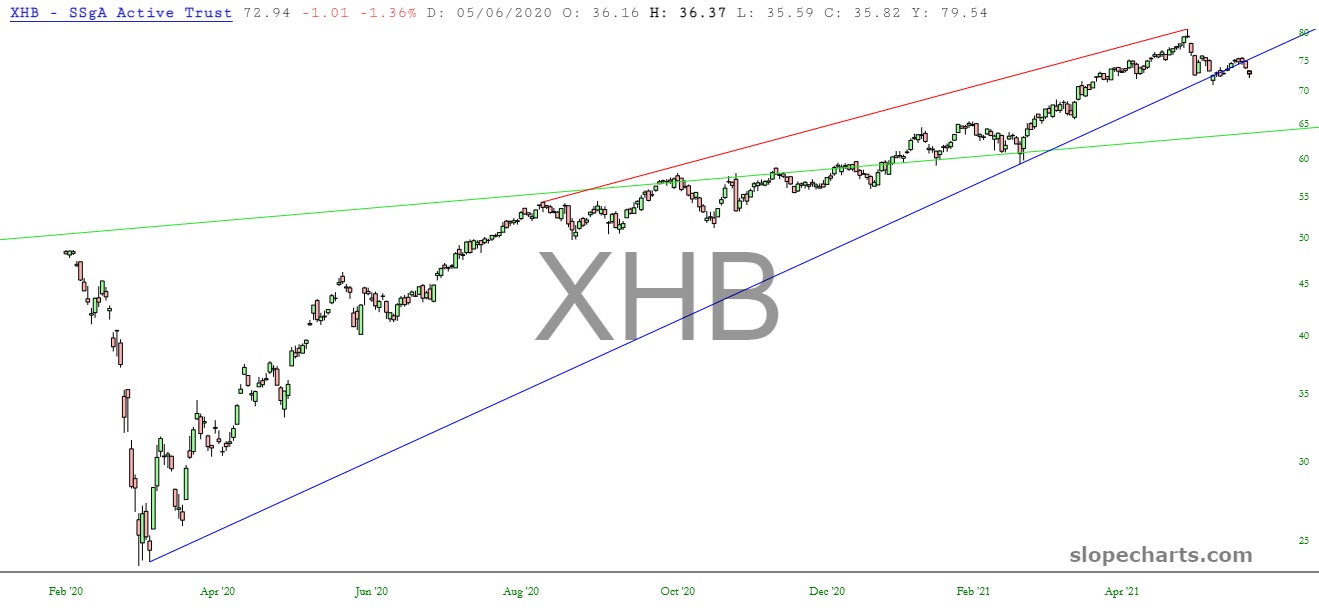
The home construction ETF has also broken its uptrend. Like so many other funds and stocks, the March 23 2020 trendline has been of crucial importance and was unbroken until quite recently.
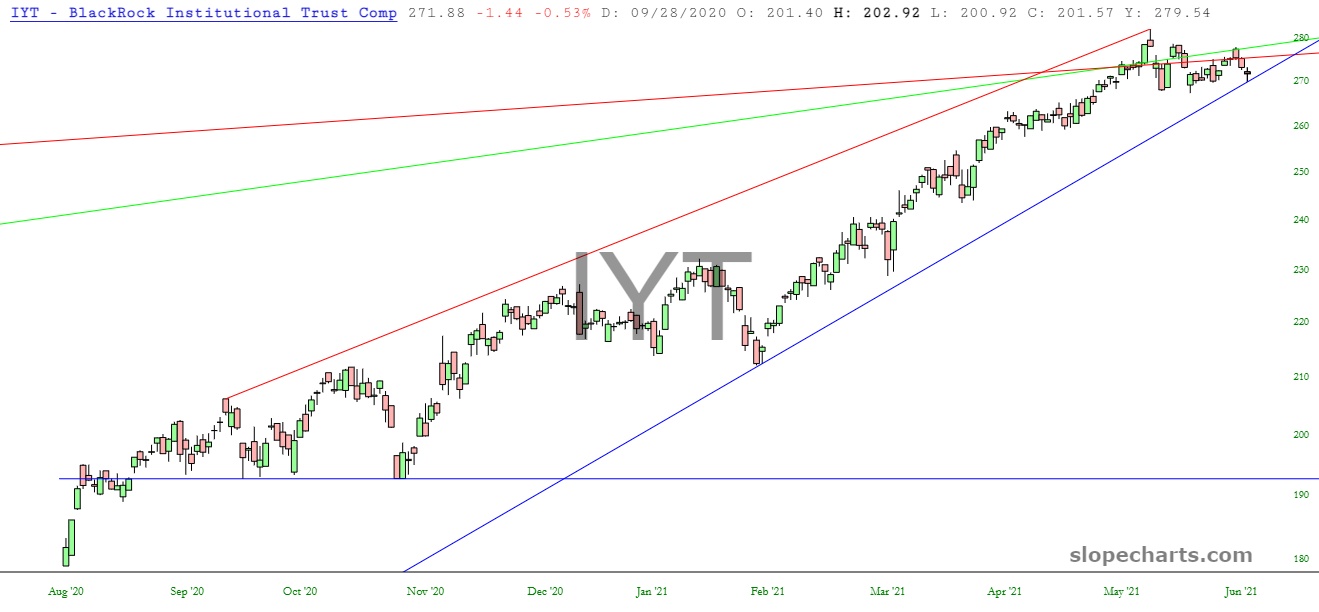
The Dow Transports has not broken its line, which its companion above (DIA) most assuredly has. Thursday’s low precisely touched the supporting trendline.
Tech stocks have been underperforming relative to SPY for many weeks, and we have been turned away at the red horizontal.
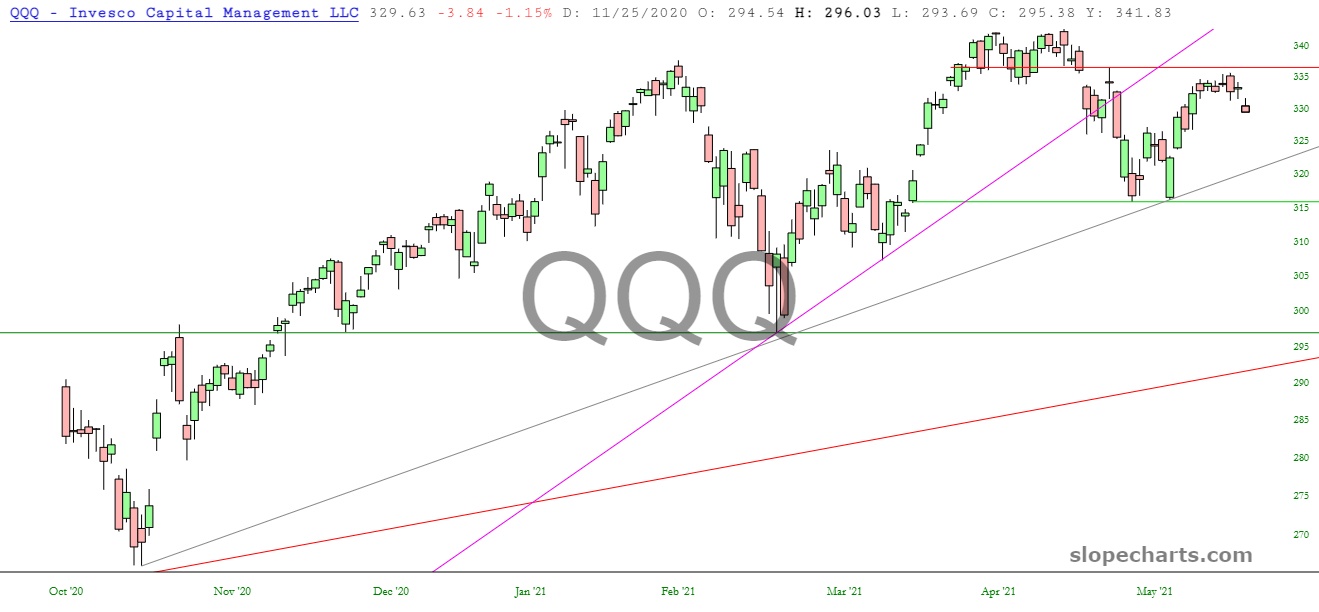
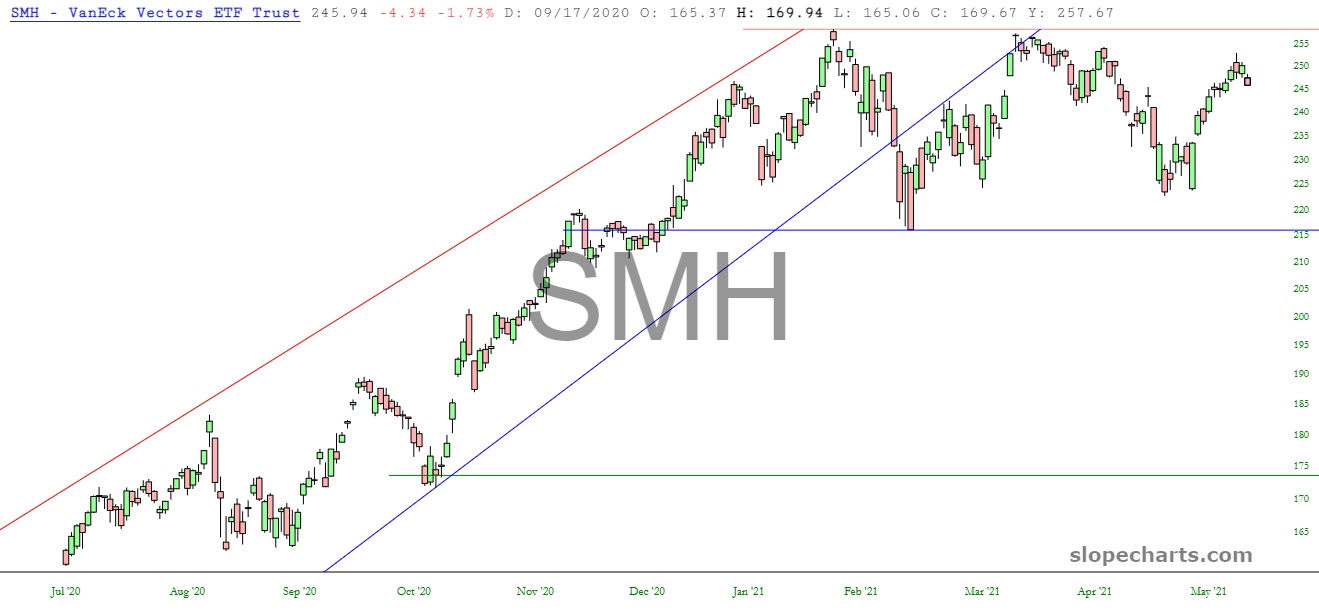
Relatedly, the semiconductor index has been meandering for months, trapped in its own sine wave.
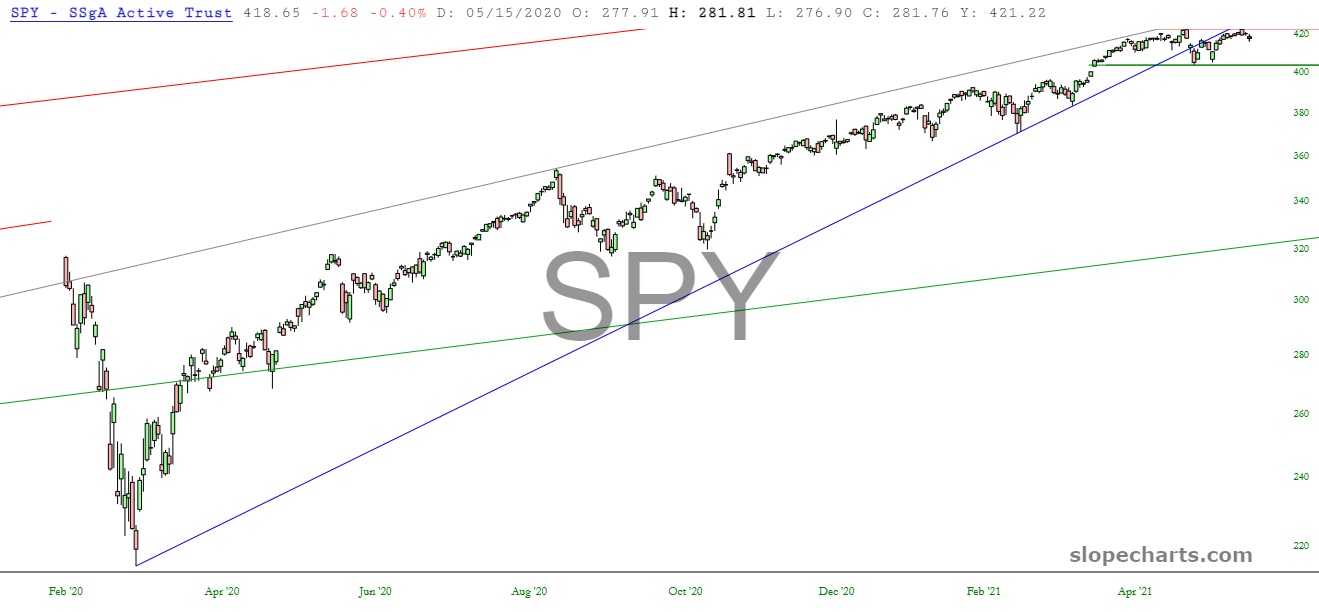
The granddaddy of them all, the S&P 500 fund, broken its uptrend weeks ago and has been ever-so-slowly creeping higher beneath the underside of the busted wedge.
Another homebuilders ETF has, similar to ITB, failed its uptrend.
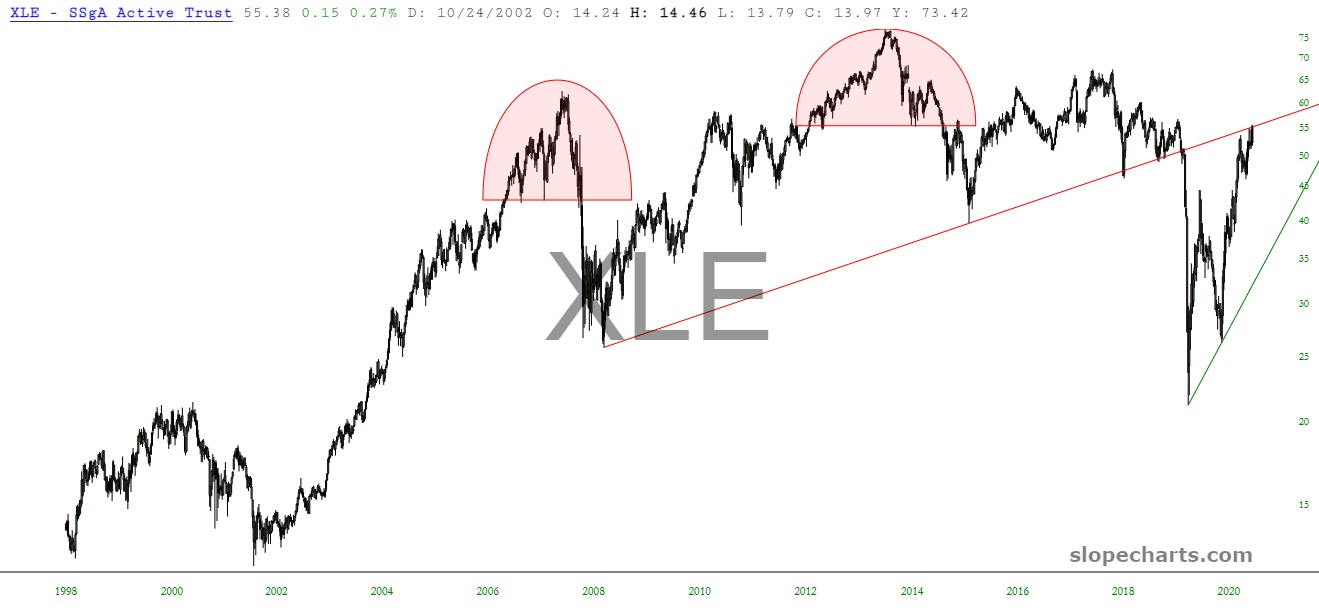
One of my favorite short ideas these days is the energy sector, and XLE is mushed right up against a long-term broken trendline. I think this is an excellent entry point.
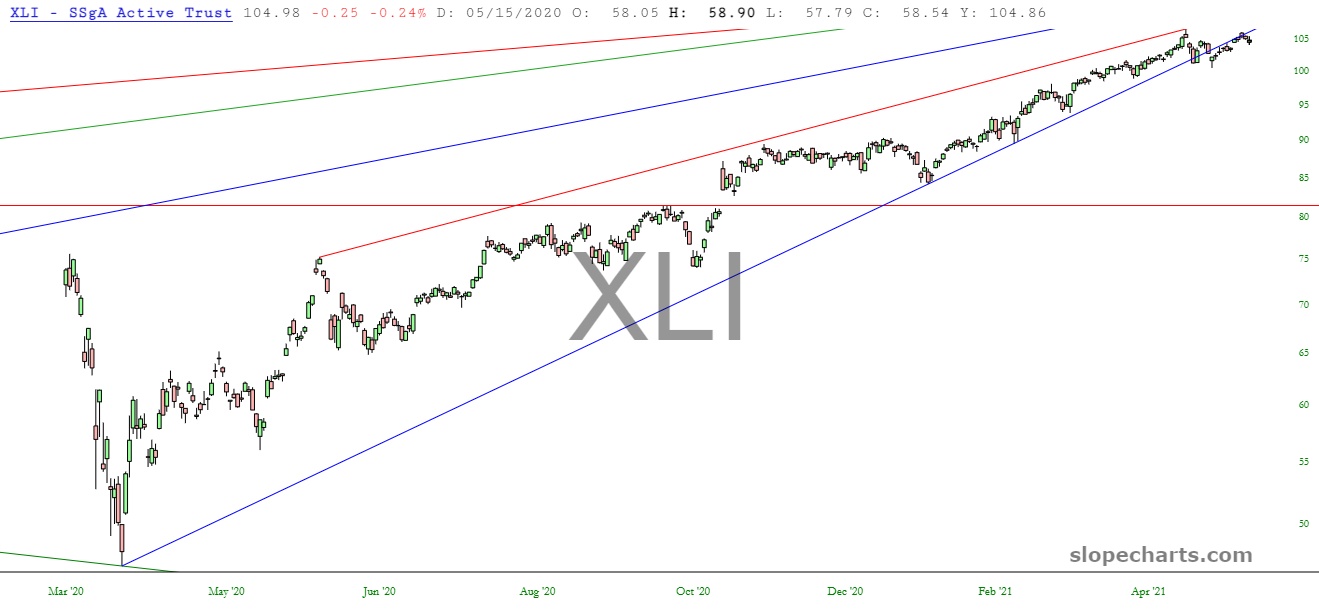
Finally the industrial fund below, similar to the “diamonds”, is just barely beneath its own broken uptrend too.
And that’s about it! I’ll see everyone on Friday so we can close out the week together.
