
I was writing on Friday about the nice looking rally setup on SPX and NDX particularly but obviously SPX was close to first resistance at the daily middle band and I was doubtful about that being broken on Friday, and it wasn’t broken then, or indeed yesterday.
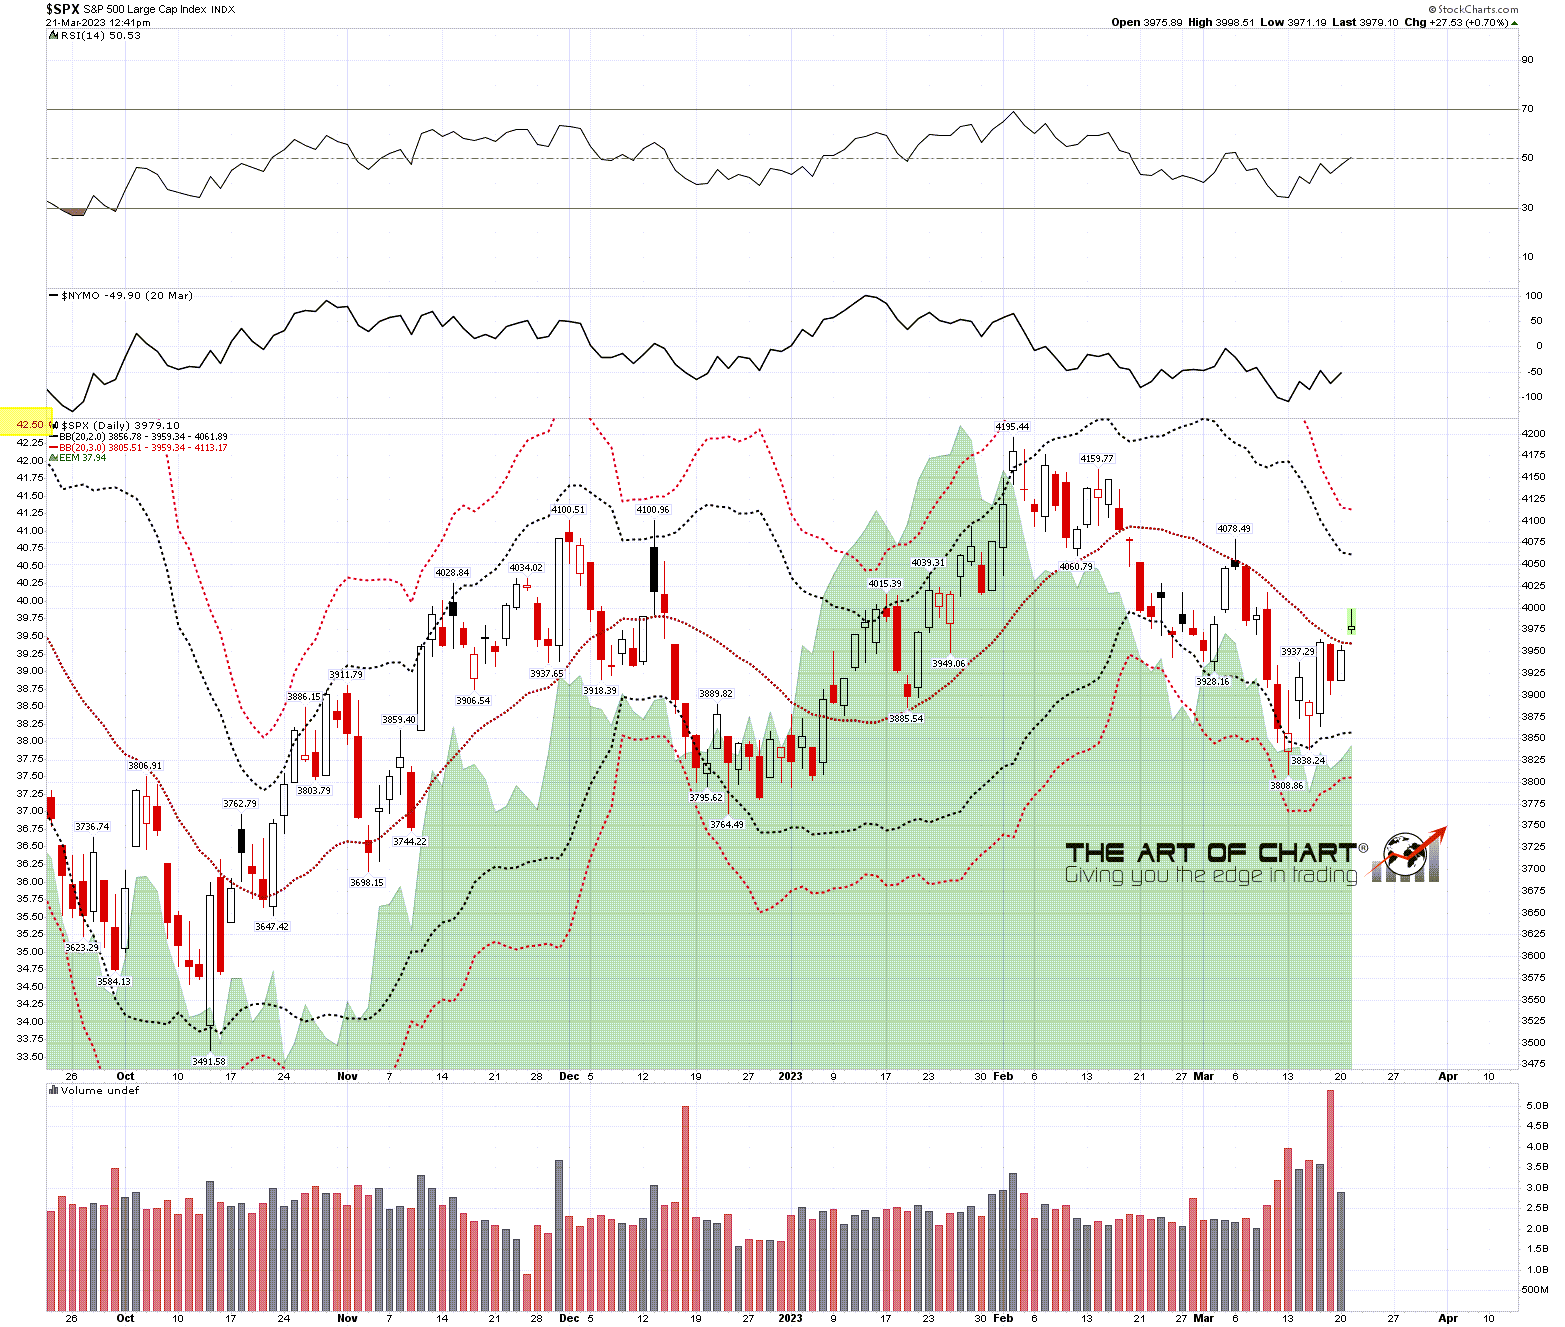
This morning though, SPX has gapped over the daily middle band, currently at 3059, and the next targets to the upside have opened up, though this rally may reached a sudden end tomorrow at FOMC when, in all probability, the Fed will fail to announce that interest rate policy will be softened over the rest of the year.
SPX daily BBs chart:
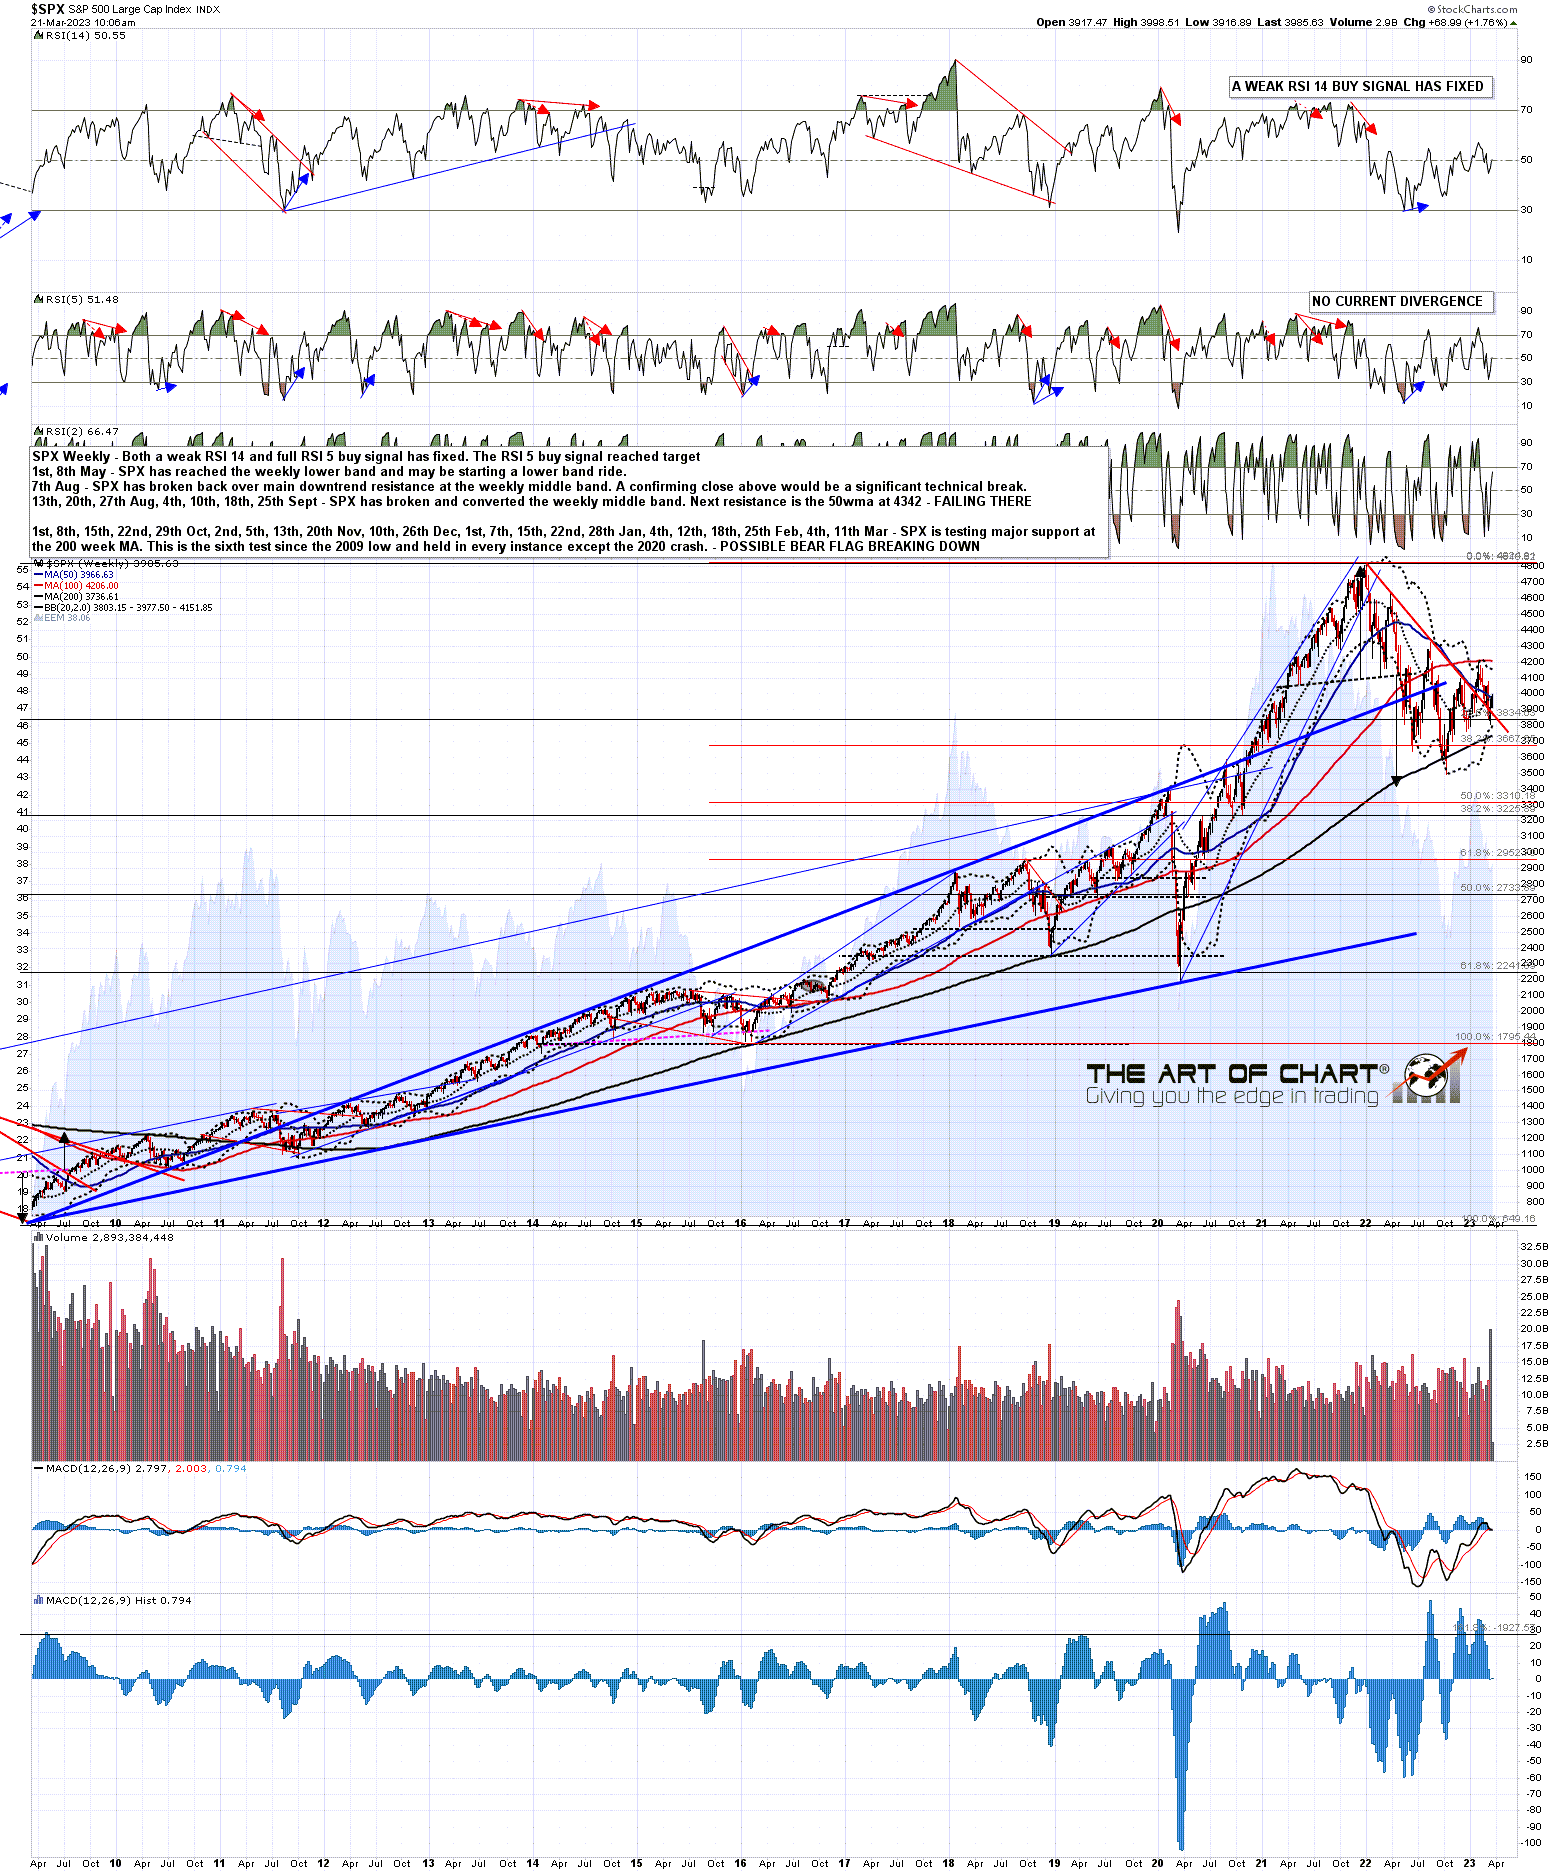
Resistance at and just above the daily middle band is on the weekly chart, and can’t of course really be broken until the close on Friday. The 50 week MA is now at 3966 and the weekly middle band is now at 3977.
SPX weekly chart:
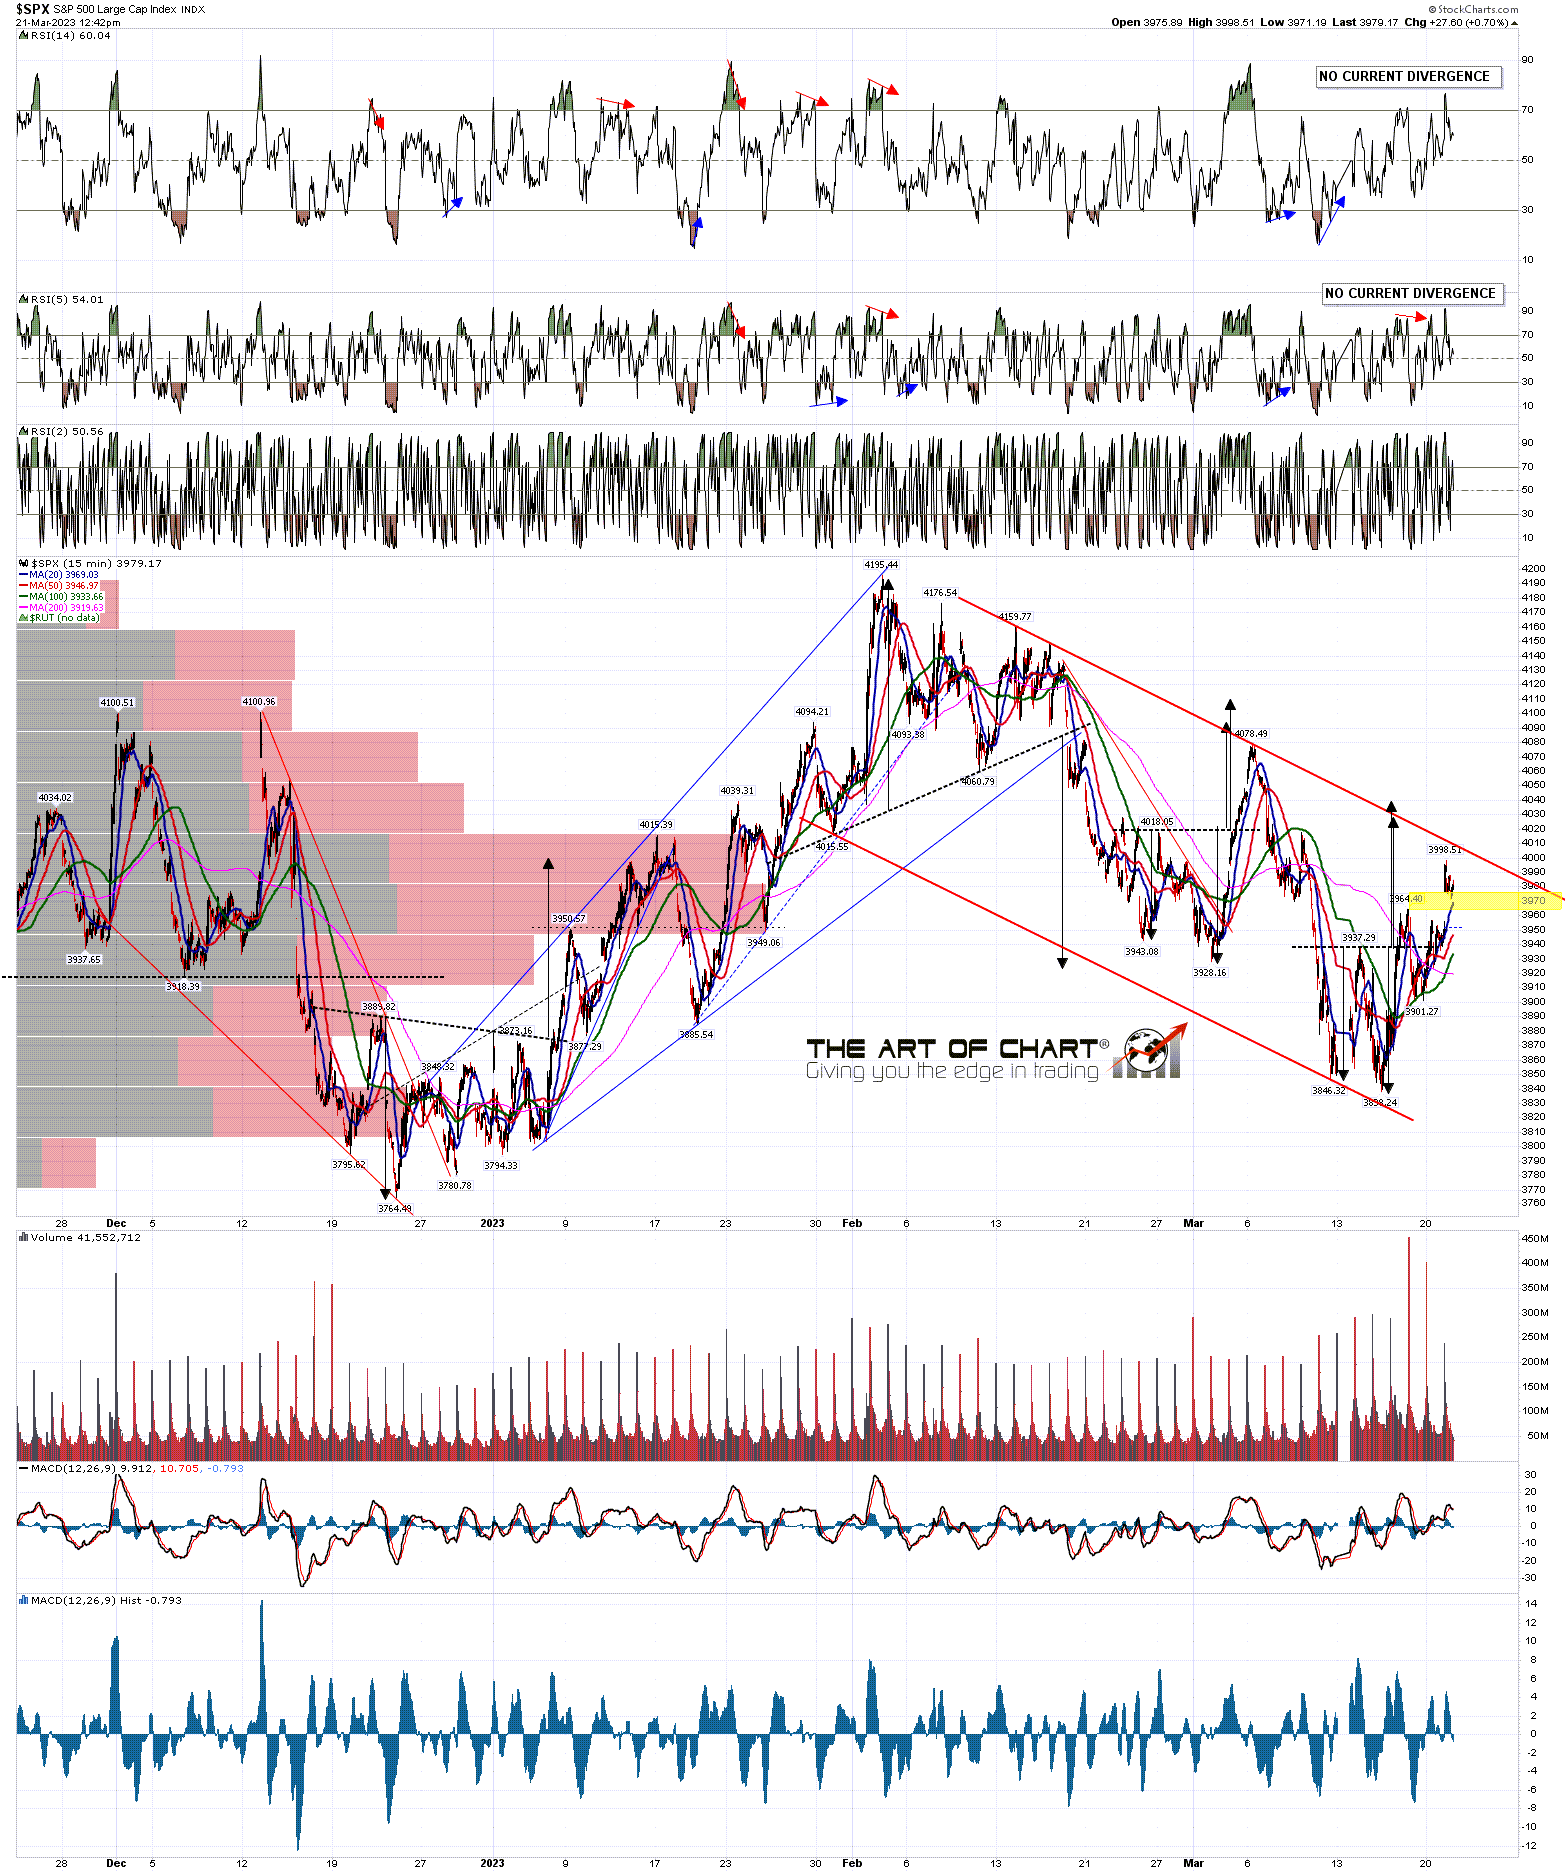
I’m watching three main US equity index charts on this rally and the first is SPX, where SPX is close to a test of declining resistance from the Feb highs, now in the 4009 area. On a break above there are open alternate double bottom targets in the 4030 and 4040 areas.
SPX 15min chart:
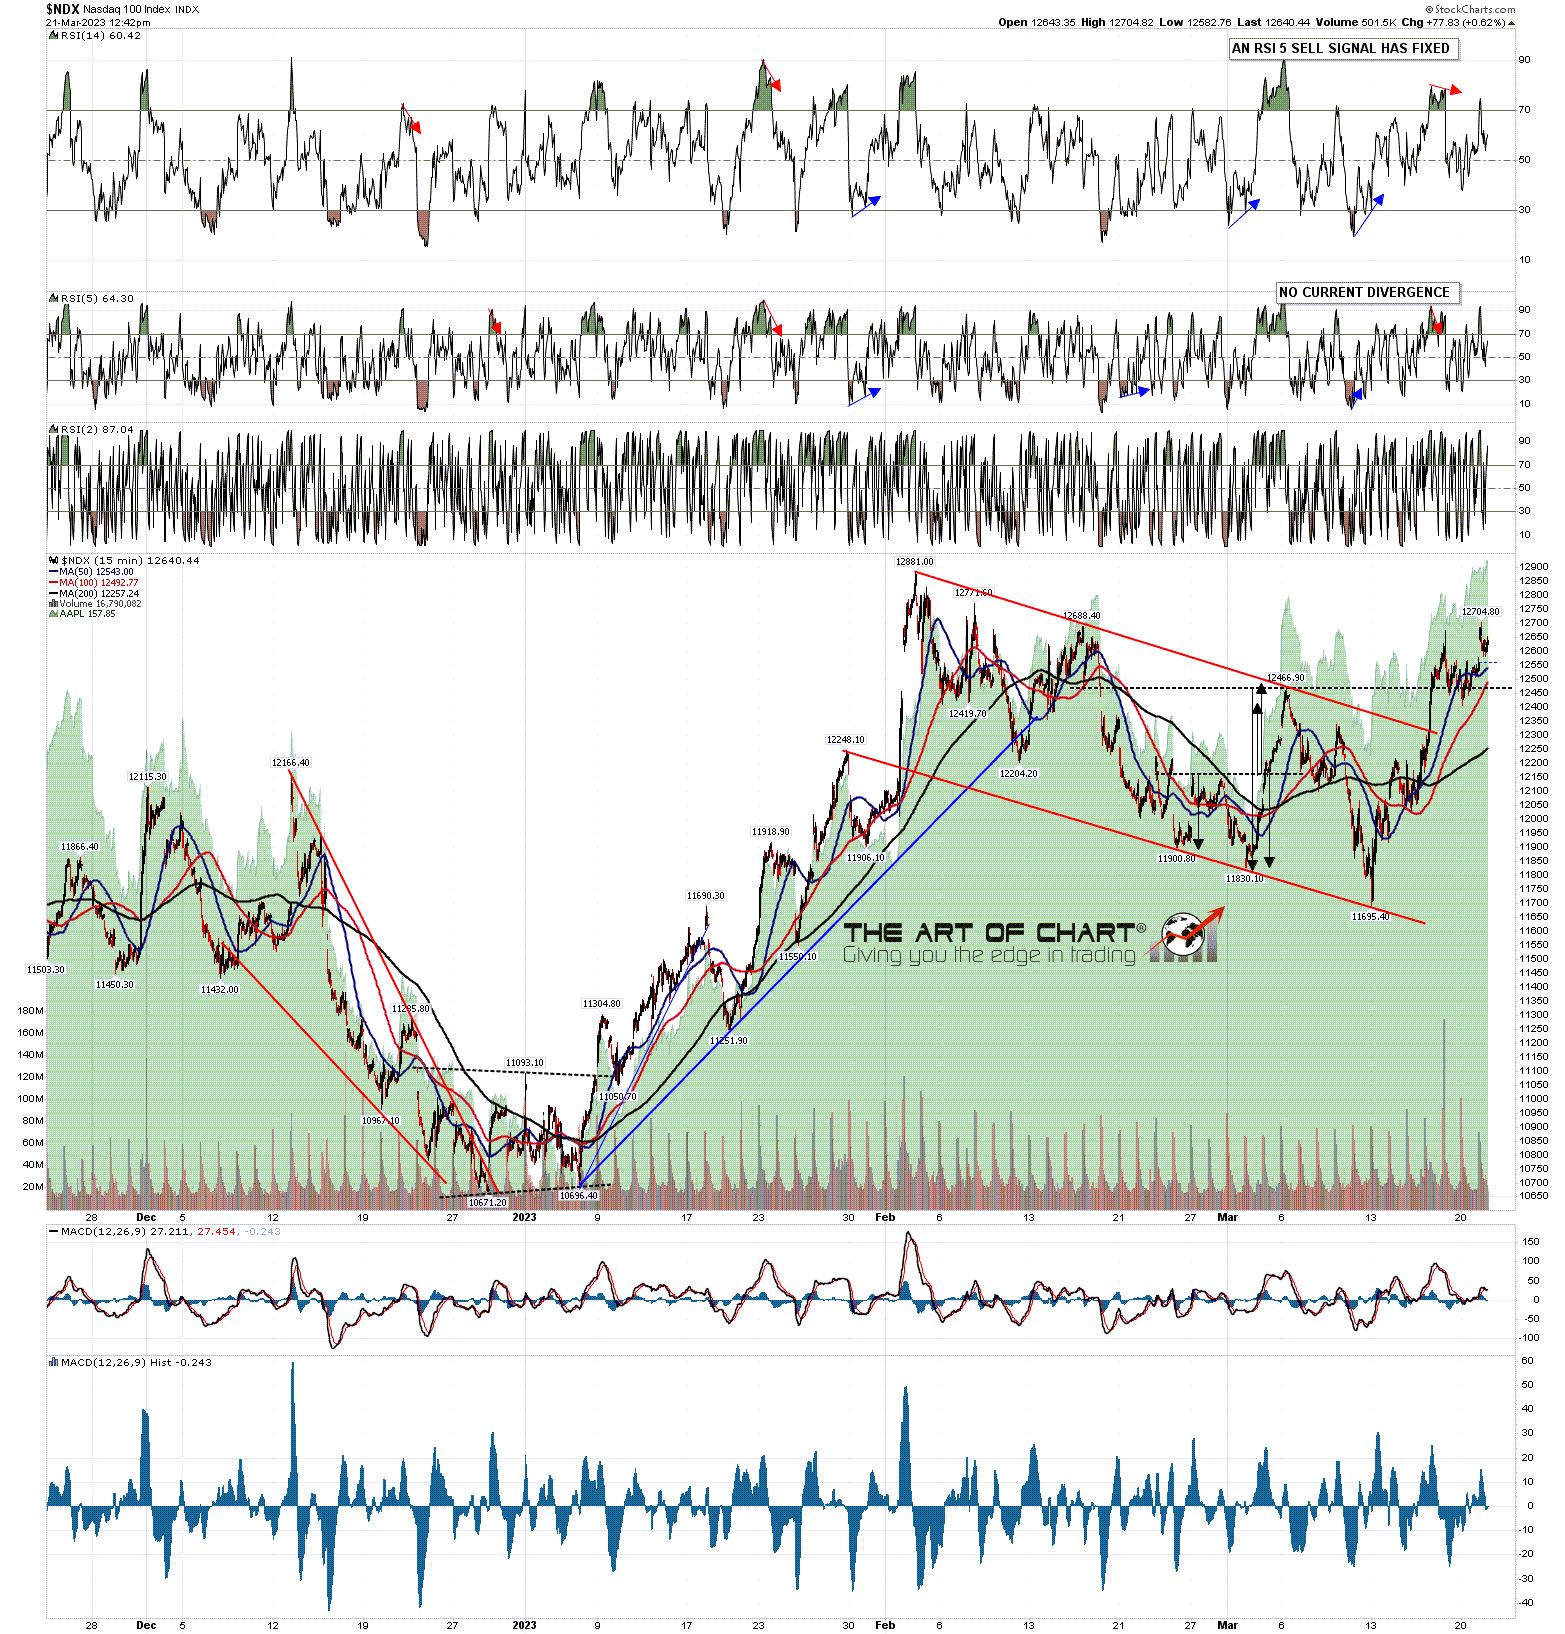
On NDX a high quality bull flag setup has broken up with a target at a retest of the February high at 12881. Not much currently to suggest that target won’t be made, though I do have some negative divergence on the hourly RSI 14.
NDX 15min chart:
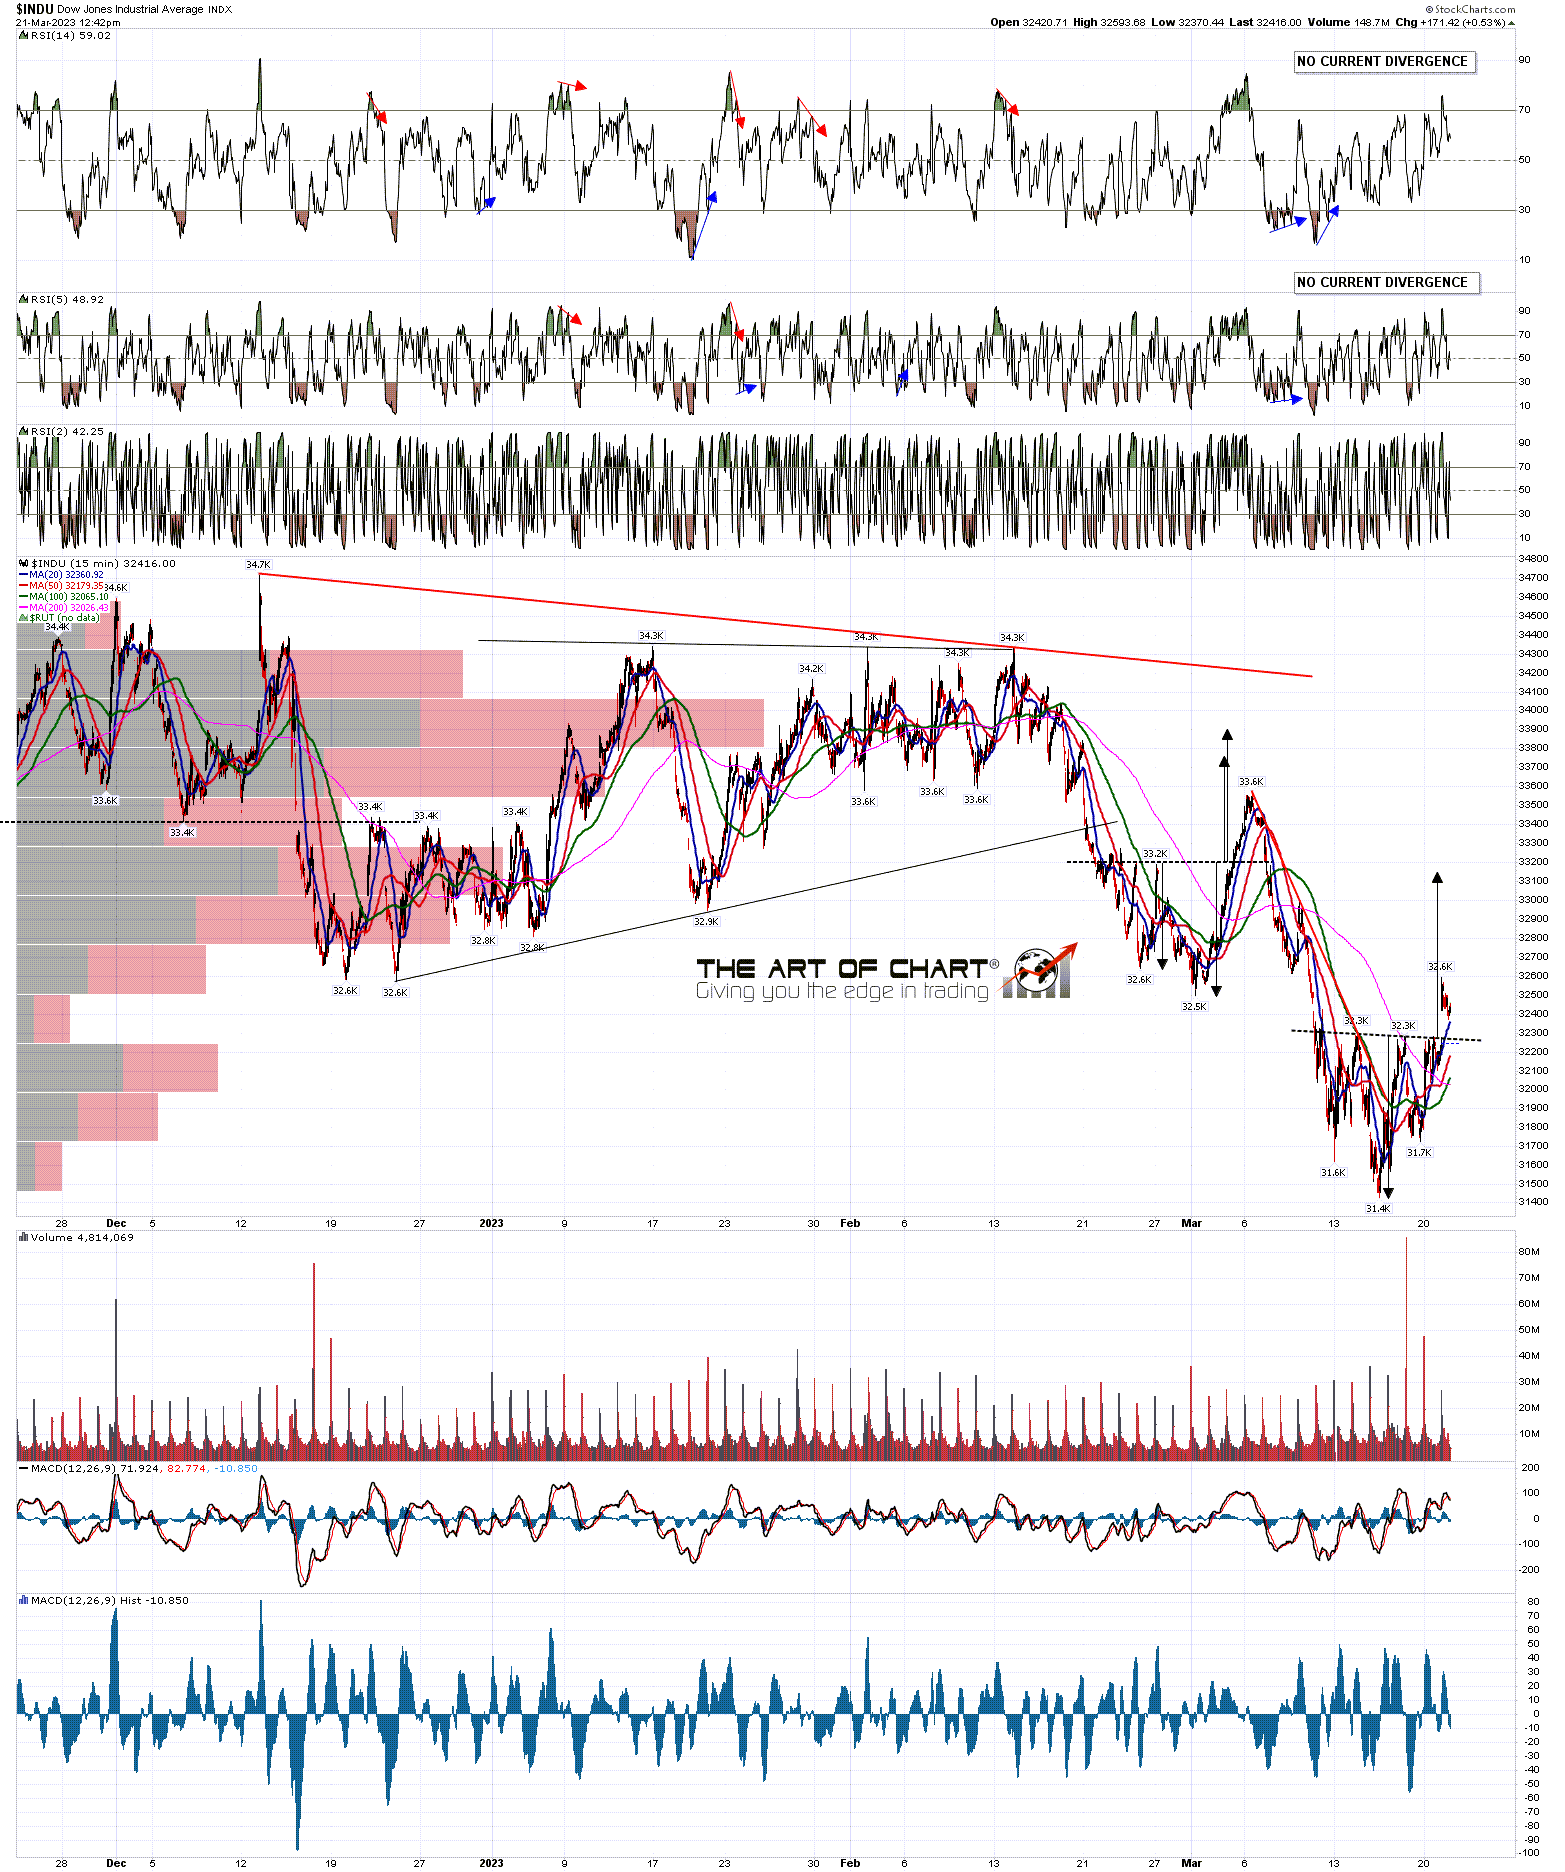
The third pattern is a high quality IHS on Dow which has broken up with a target in the 33150 area. Typically this would either head to the target, or fail back into the IHS low at 31.7k.
INDU 15min chart:
For the obvious reasons I’m skeptical about this rally surviving FOMC tomorrow and Thursday, but in the short term I’d expect to see at least some more upside.
An hour after the close on Thursday we are doing our monthly free public webinar at theartofchart.net looking at FAANG stocks and Key Sectors. If you’d like to see that you can register for that here, or on our March Free Webinars page.
