
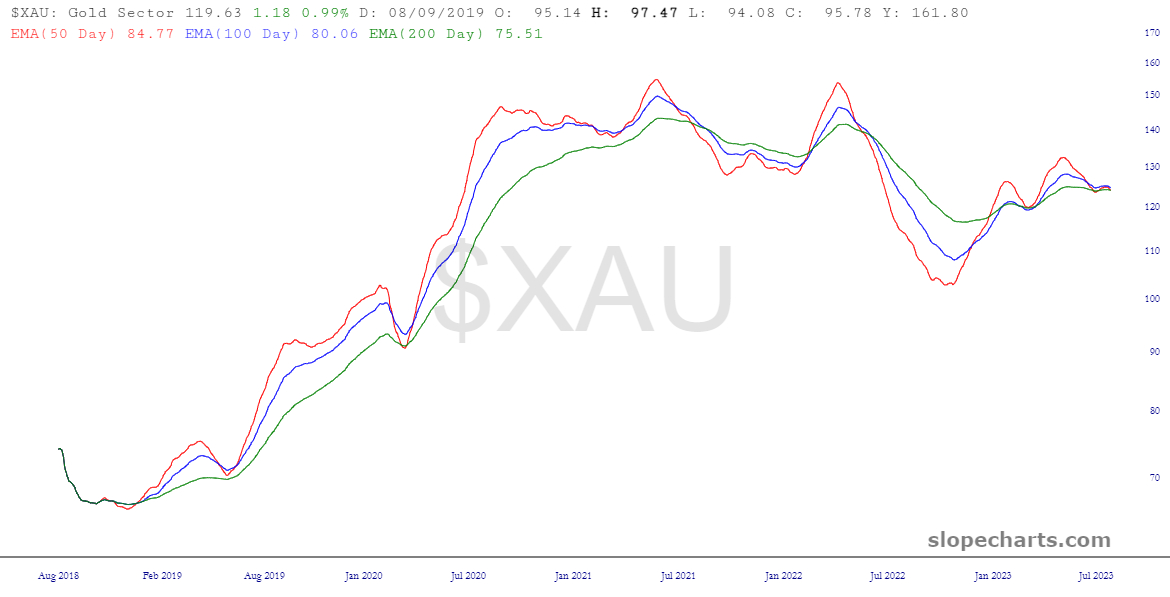
I went through my 28 index charts, hiding everything EXCEPT for the standard three moving averages (50, 100, and 200 day exponential). The vast majority of them look something like this since, as lagging indicators, they are reflecting the risible rise in assets for the first seven preposterous months of 2023 and will continue to do so until the crumbling becomes clear.

Some assets have a head start, however, such as the gold sector.
And, almost identically, the gold bugs index.

Indeed, the only NON precious metals critter which looks deliciously bearish is my new bride, with whom I am still in the honeymoon phase, known as the Dow Utilities. This is picture perfect.

If for any reason we get a strong bounce in XLU (and I’m kind of hoping we do), I am going to gobble up many more puts, but at a lower strike price, since at this point it’s all about quantity.
