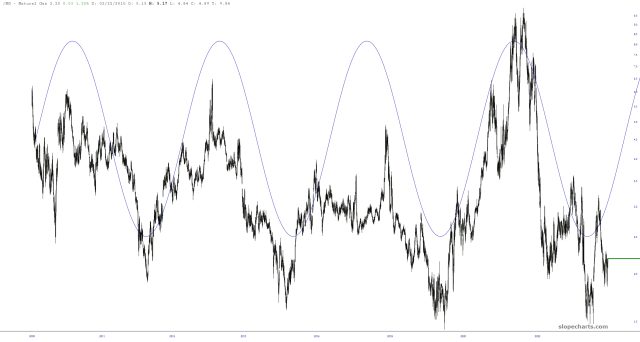
I love this long-term cycle chart of natural gas prices:
Slope initially began as a blog, so this is where most of the website’s content resides. Here we have tens of thousands of posts dating back over a decade. These are listed in reverse chronological order. Click on any category icon below to see posts tagged with that particular subject, or click on a word in the category cloud on the right side of the screen for more specific choices.
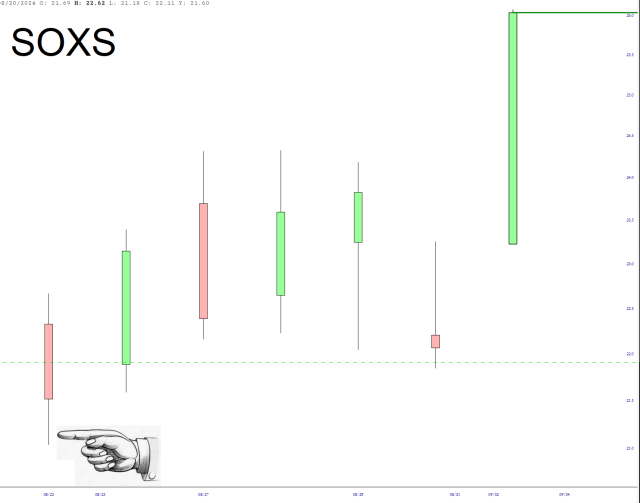
In the midst of that son of a bitch bastard traitor Powell on Friday the 23rd, I was the only person on the entire planet insane enough to suggest, of all things, buying a TRIPLE BEARISH ETF on semiconductors, SOXS. Here’s the proof. And below is what happened next. Not a single buyer would have even seen one penny of loss. Amazing.
After 9/11, we should have just bombed the holy hell out of Afghanistan and then left them alone. What an idiotic waste of blood and treasure. Now it’s just an insane country packed with Islamic nut-jobs with latent homosexual tendencies which they get to play out with their boy toys. A sick, evil place.

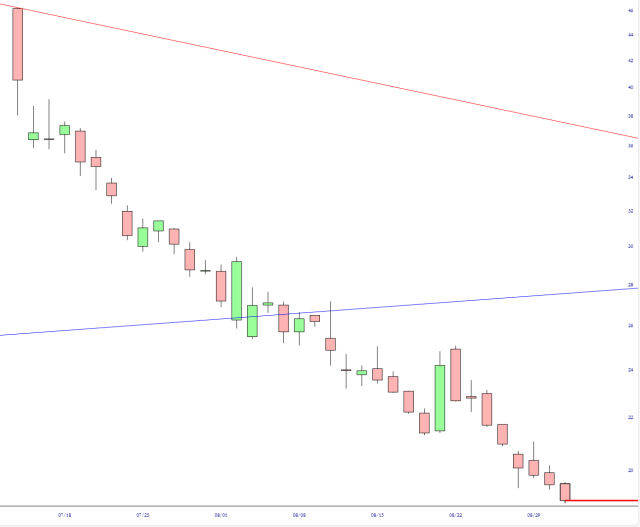
Below is a chart of DJT, which is extraordinary, if nothing else, in its consistency. This investor came up to me – – big guy, strong guy – – with tears in his eyes – – and he said to me, he said, “Sir, why does DJT go down almost every day, even during days of market strength?” And I looked behind him, and there were these two flags, and I was amazed at what I saw. What happened, and many people are saying this, is that they became an angel.
Look, I try to be careful when I say anything about Bitcoin, because these HODL freaks make Scientologists look positively sensible. I must share, however, the latest ramblings of these nut-jobs, who actually think speculating on the price of something over a quarter century from now isn’t an abject waste of time. Good God, these people are insane.
