
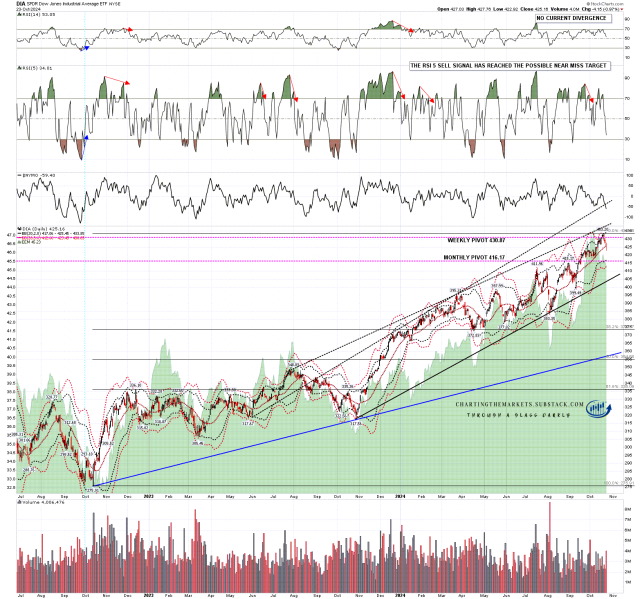
Yesterday we saw a decent decline which was well overdue and, of the two fixed daily sell signals still fixed on the US indices, the one on DIA reached the possible near miss target, so I’m now disregarding that one, though a follow through decline that closes significantly lower today would likely reach the full target.
DIA broke slightly below the daily middle band, but rallied to effectively close on it, so no clear break. So far for me then, the daily middle band is still holding as support.
If we go a lot lower, then there is a possible rising support trendline target in the 403 area.
DIA daily chart:
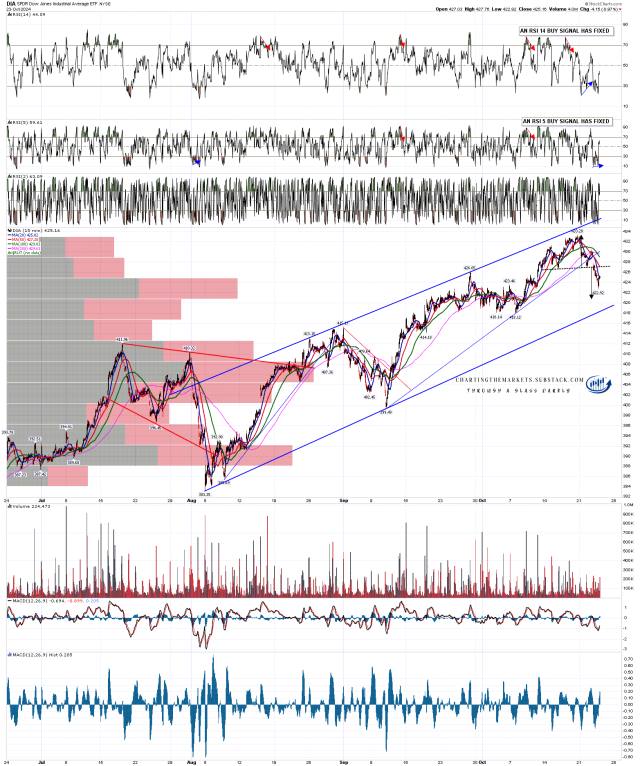
On the 15min chart a high quality H&S has broken down with a target in the 421 area, and the rising wedge support trendline is a strong target not far below in the 418.5 area.
DIA 15min chart:
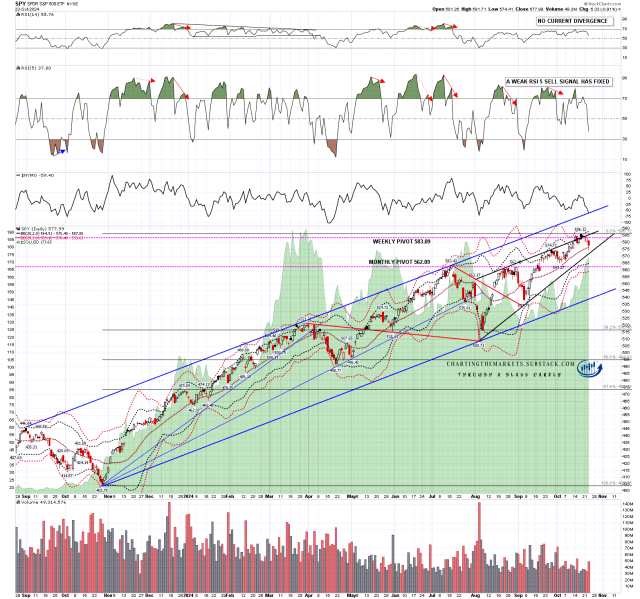
On SPY the fixed weak RSI 5 sell signal had upgraded to a full RSI 5 sell signal at the last high. That almost reached the possible near miss target yesterday, but not quite, so there is some unfinished business below.
SPX dropped slightly below the daily middle band intraday yesterday but closed over it, so support there has held so far.
SPY daily chart:
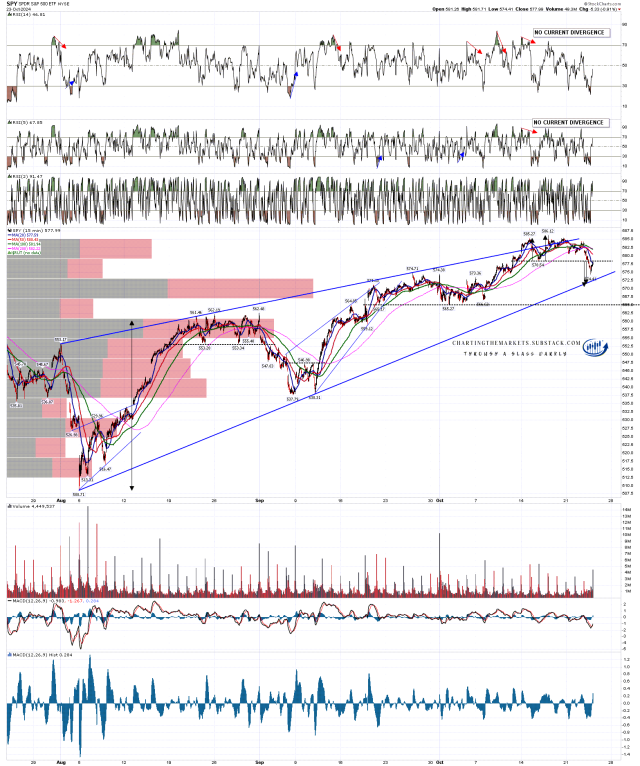
On the SPY 15min chart a small double top has broken down with a target range 570.5 to 571.5. There is possible support on the way at rising wedge support from the August low at 573. If both targets are hit and exceeded then there is a possible H&S neckline and more support down in the 565 area.
SPY 15min chart:
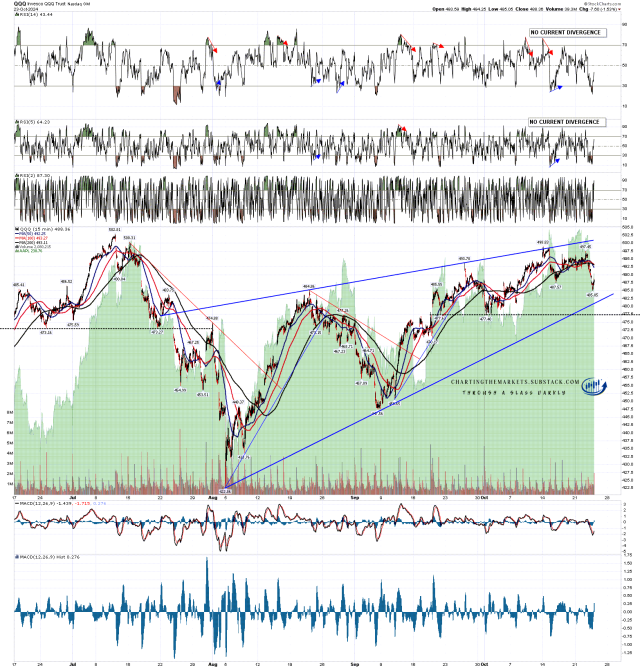
IWM and QQQ have been the weakest on this decline and both closed yesterday under their daily middle bands. No topping patterns on either and there were short term buy signals on both the IWM 15min and RTY 60min charts, both of which look likely to be a bit short of target at the open today.
On the QQQ chart this could well be a bull flag forming, but I’m watching possible rising wedge support, currently in the 481 area.
QQQ 15min chart:
There is likely unfinished business below, and some follow through downside today or tomorrow would likely make the SPX daily RSI 5 sell signal minimum target and the targets on the SPX and DIA topping patterns. I’m leaning towards seeing that.
I went through all of this in detail in my The Bigger Picture video last night. If you’d like to see that then you can find that here.
If you like my analysis and would like to see more, please take a free subscription at my chartingthemarkets substack, where I publish these posts first and do a short premarket review every morning.
