
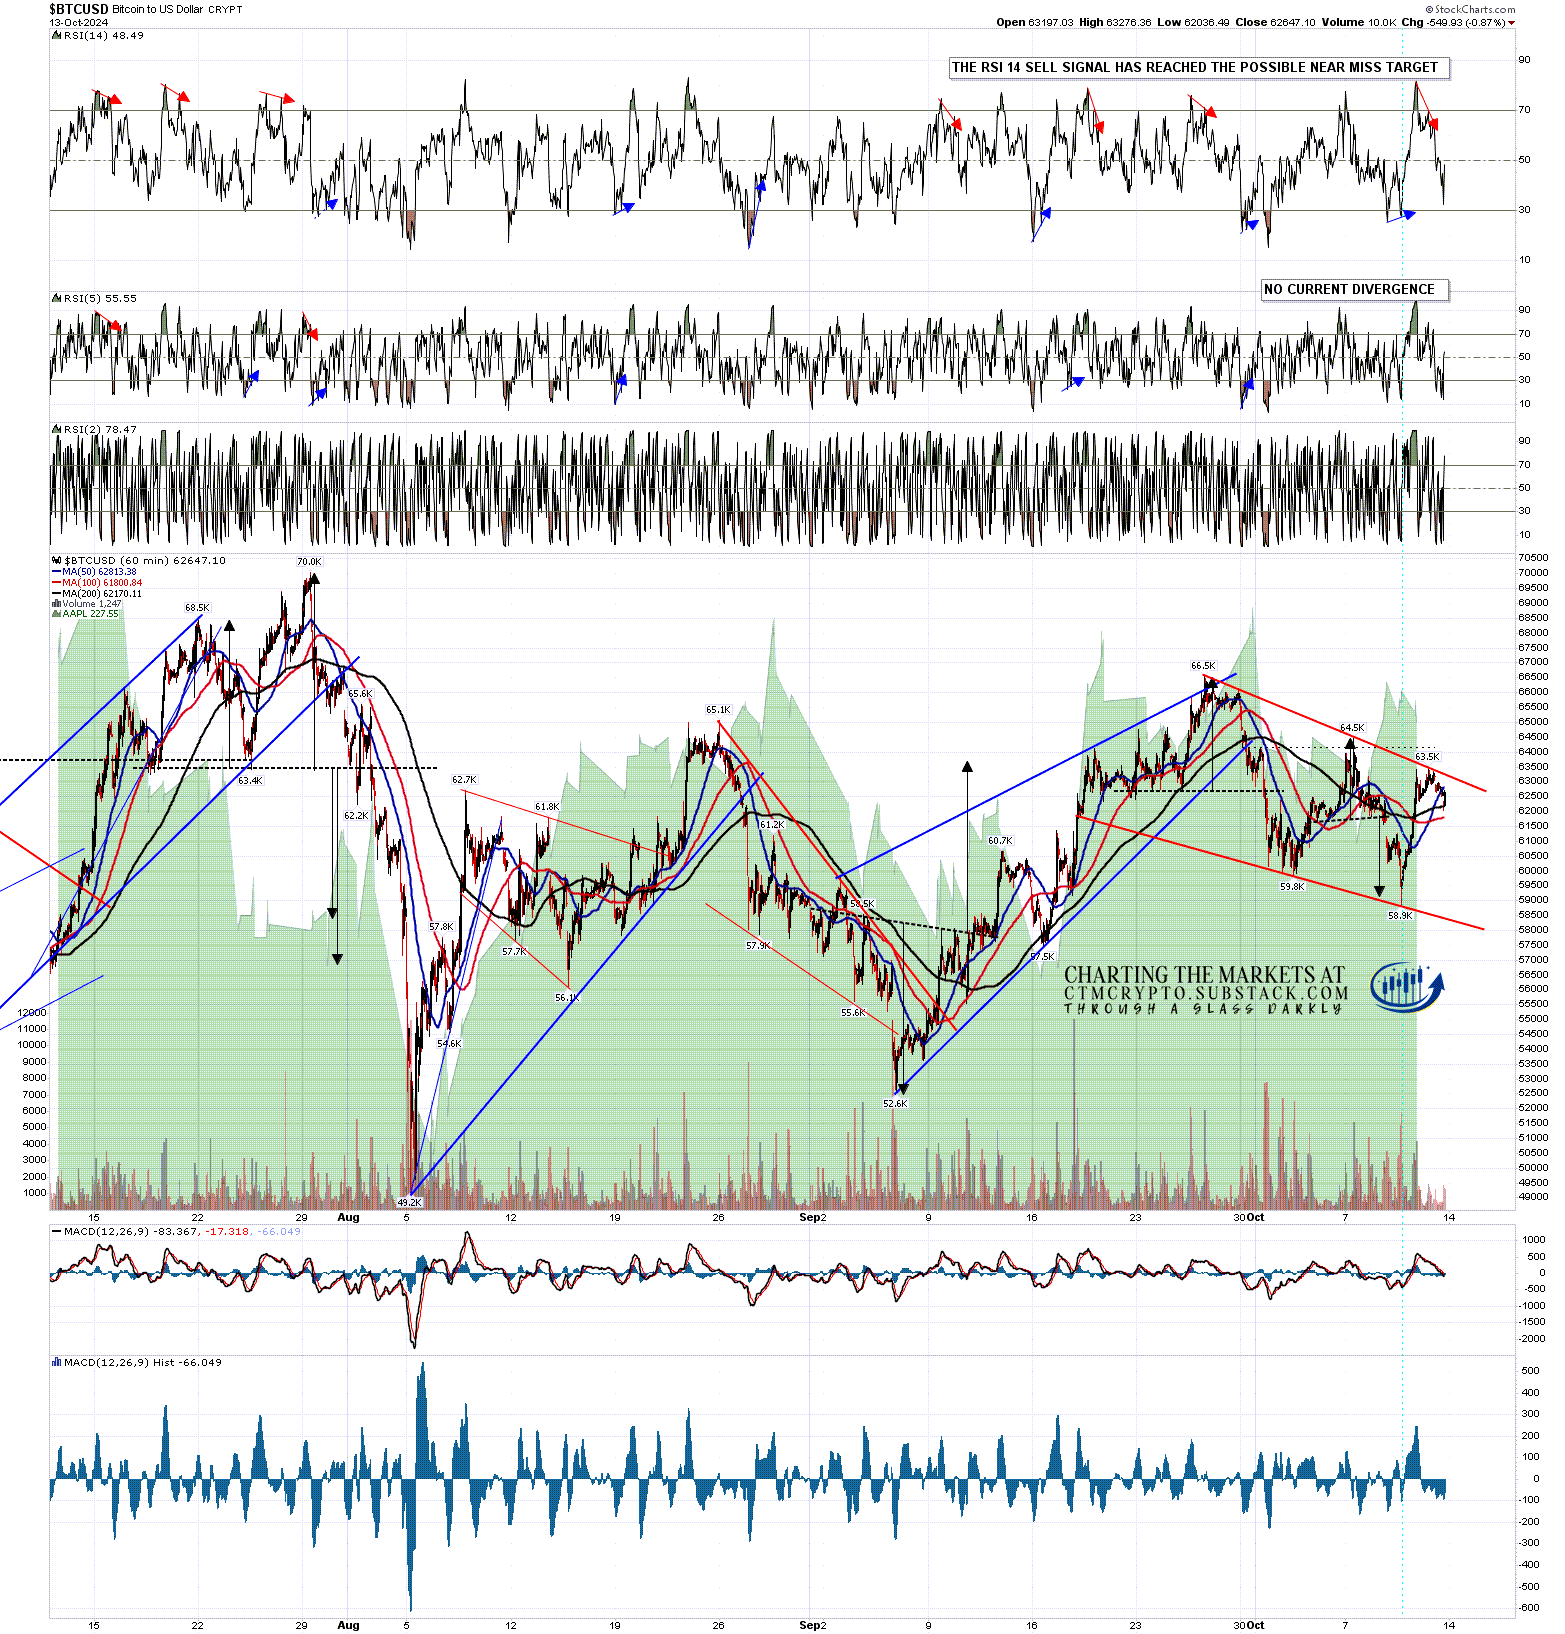
Yesterday afternoon I sent a quick update post to all the subscribers at my Crypto SubStack to warn them that there was now a high quality bull flag setup on Bitcoin (BTCUSD) that on a break up would look for a target at a retest of the September high at 66.5k. I also noted that the hourly RSI 14 sell signal that had formed and fixed as Bitcoin was hitting flag resistance had reached the possible near miss target. I was thinking of circulating this more widely but SubStack was having issues yesterday afternoon, so I thought I’d just cover this in a post today.
This is the chart I posted yesterday.
BTCUSD 60min chart (yesterday afternoon):
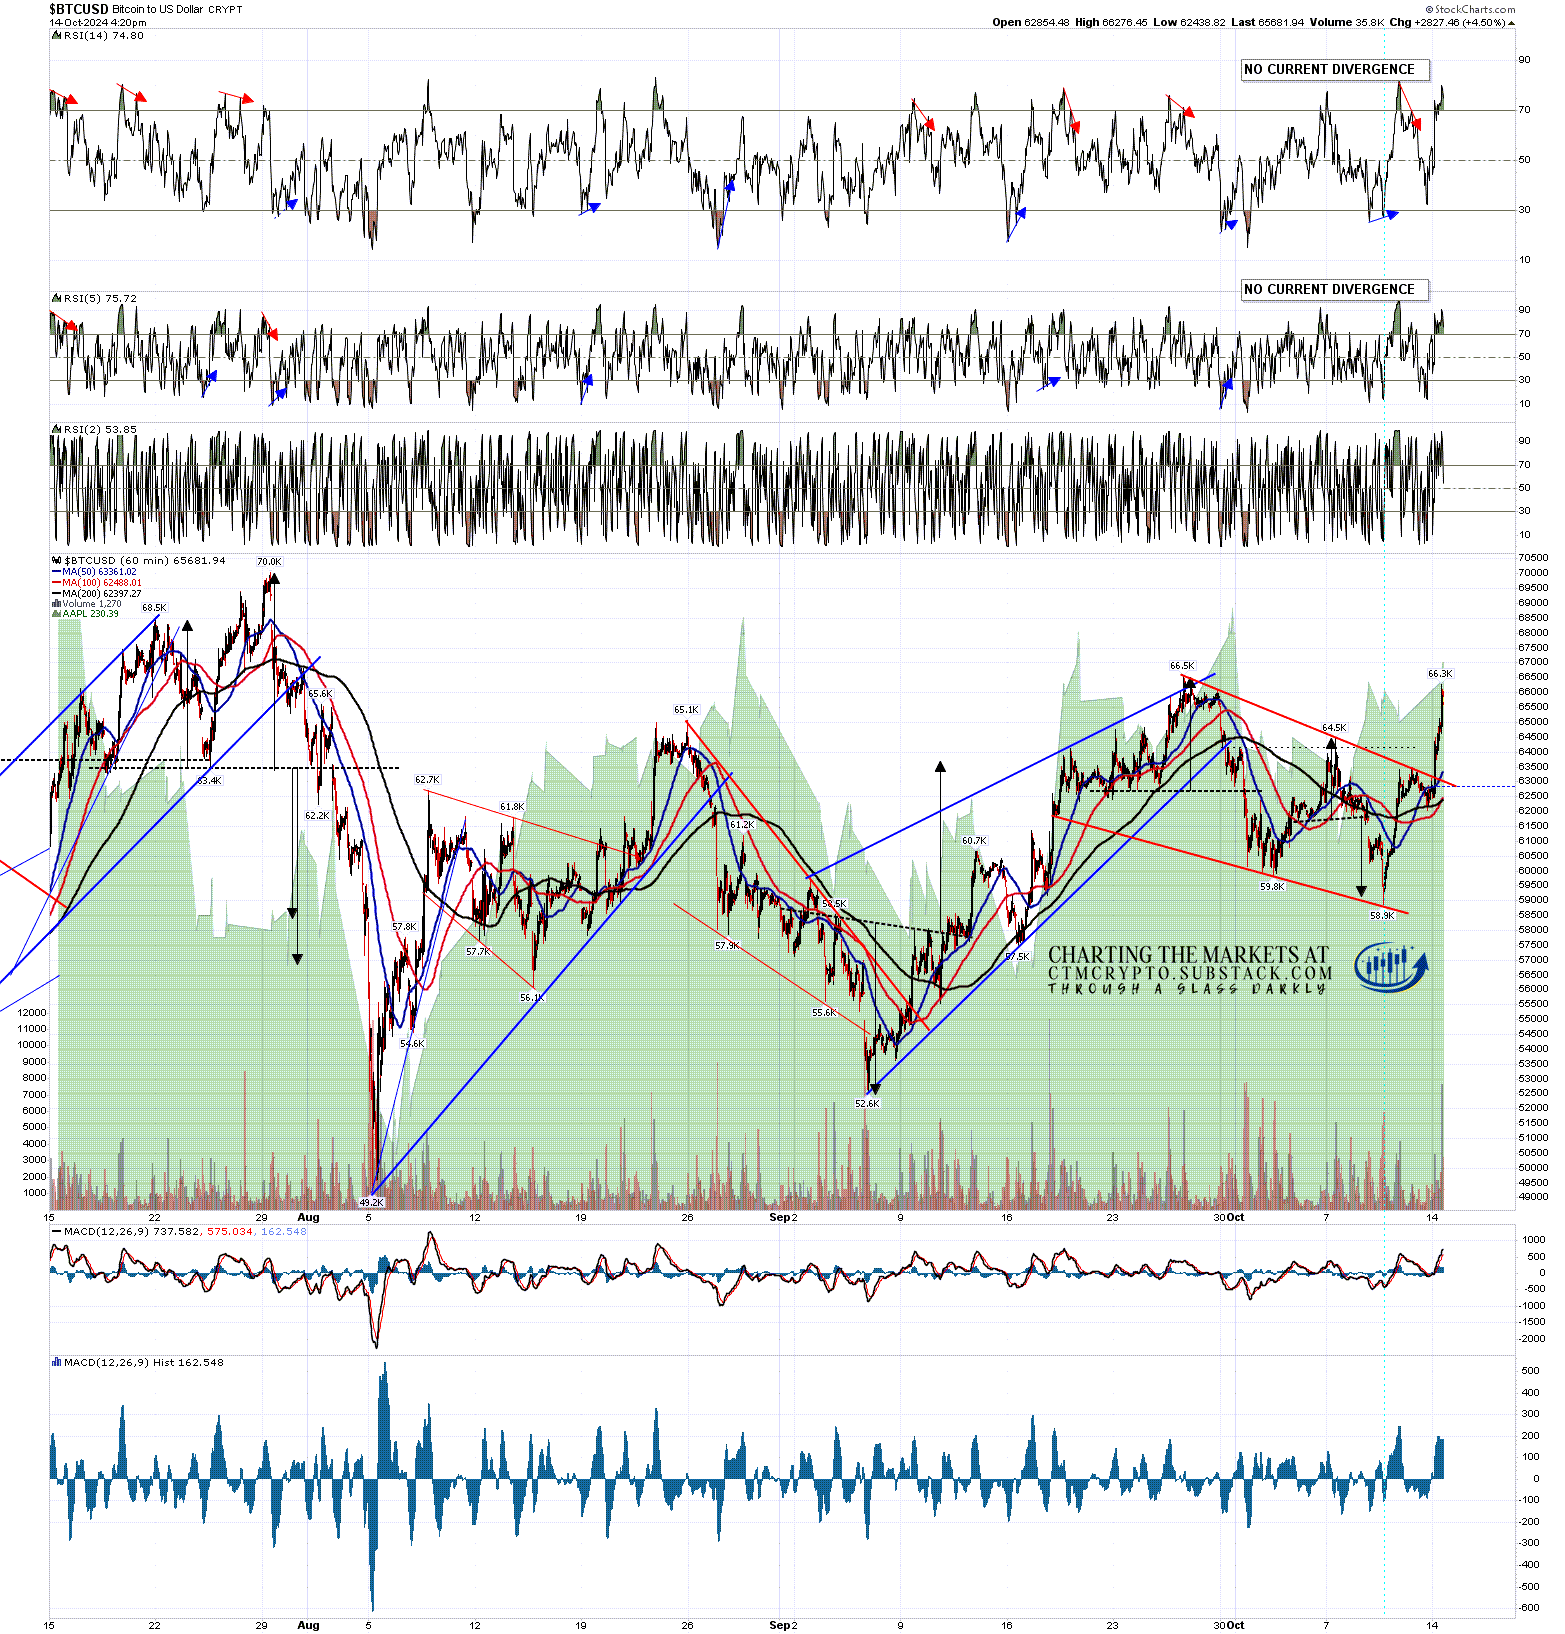
This is how the chart looks at the time of writing, with the flag having broken up and got fairly close to the flag target. I’m expecting that target should likely hit in the next day or two. It is therefore too late now to warn anyone today but that does bring me to the bigger picture that I have also been looking at over the last few posts.
BTCUSD 60min chart:
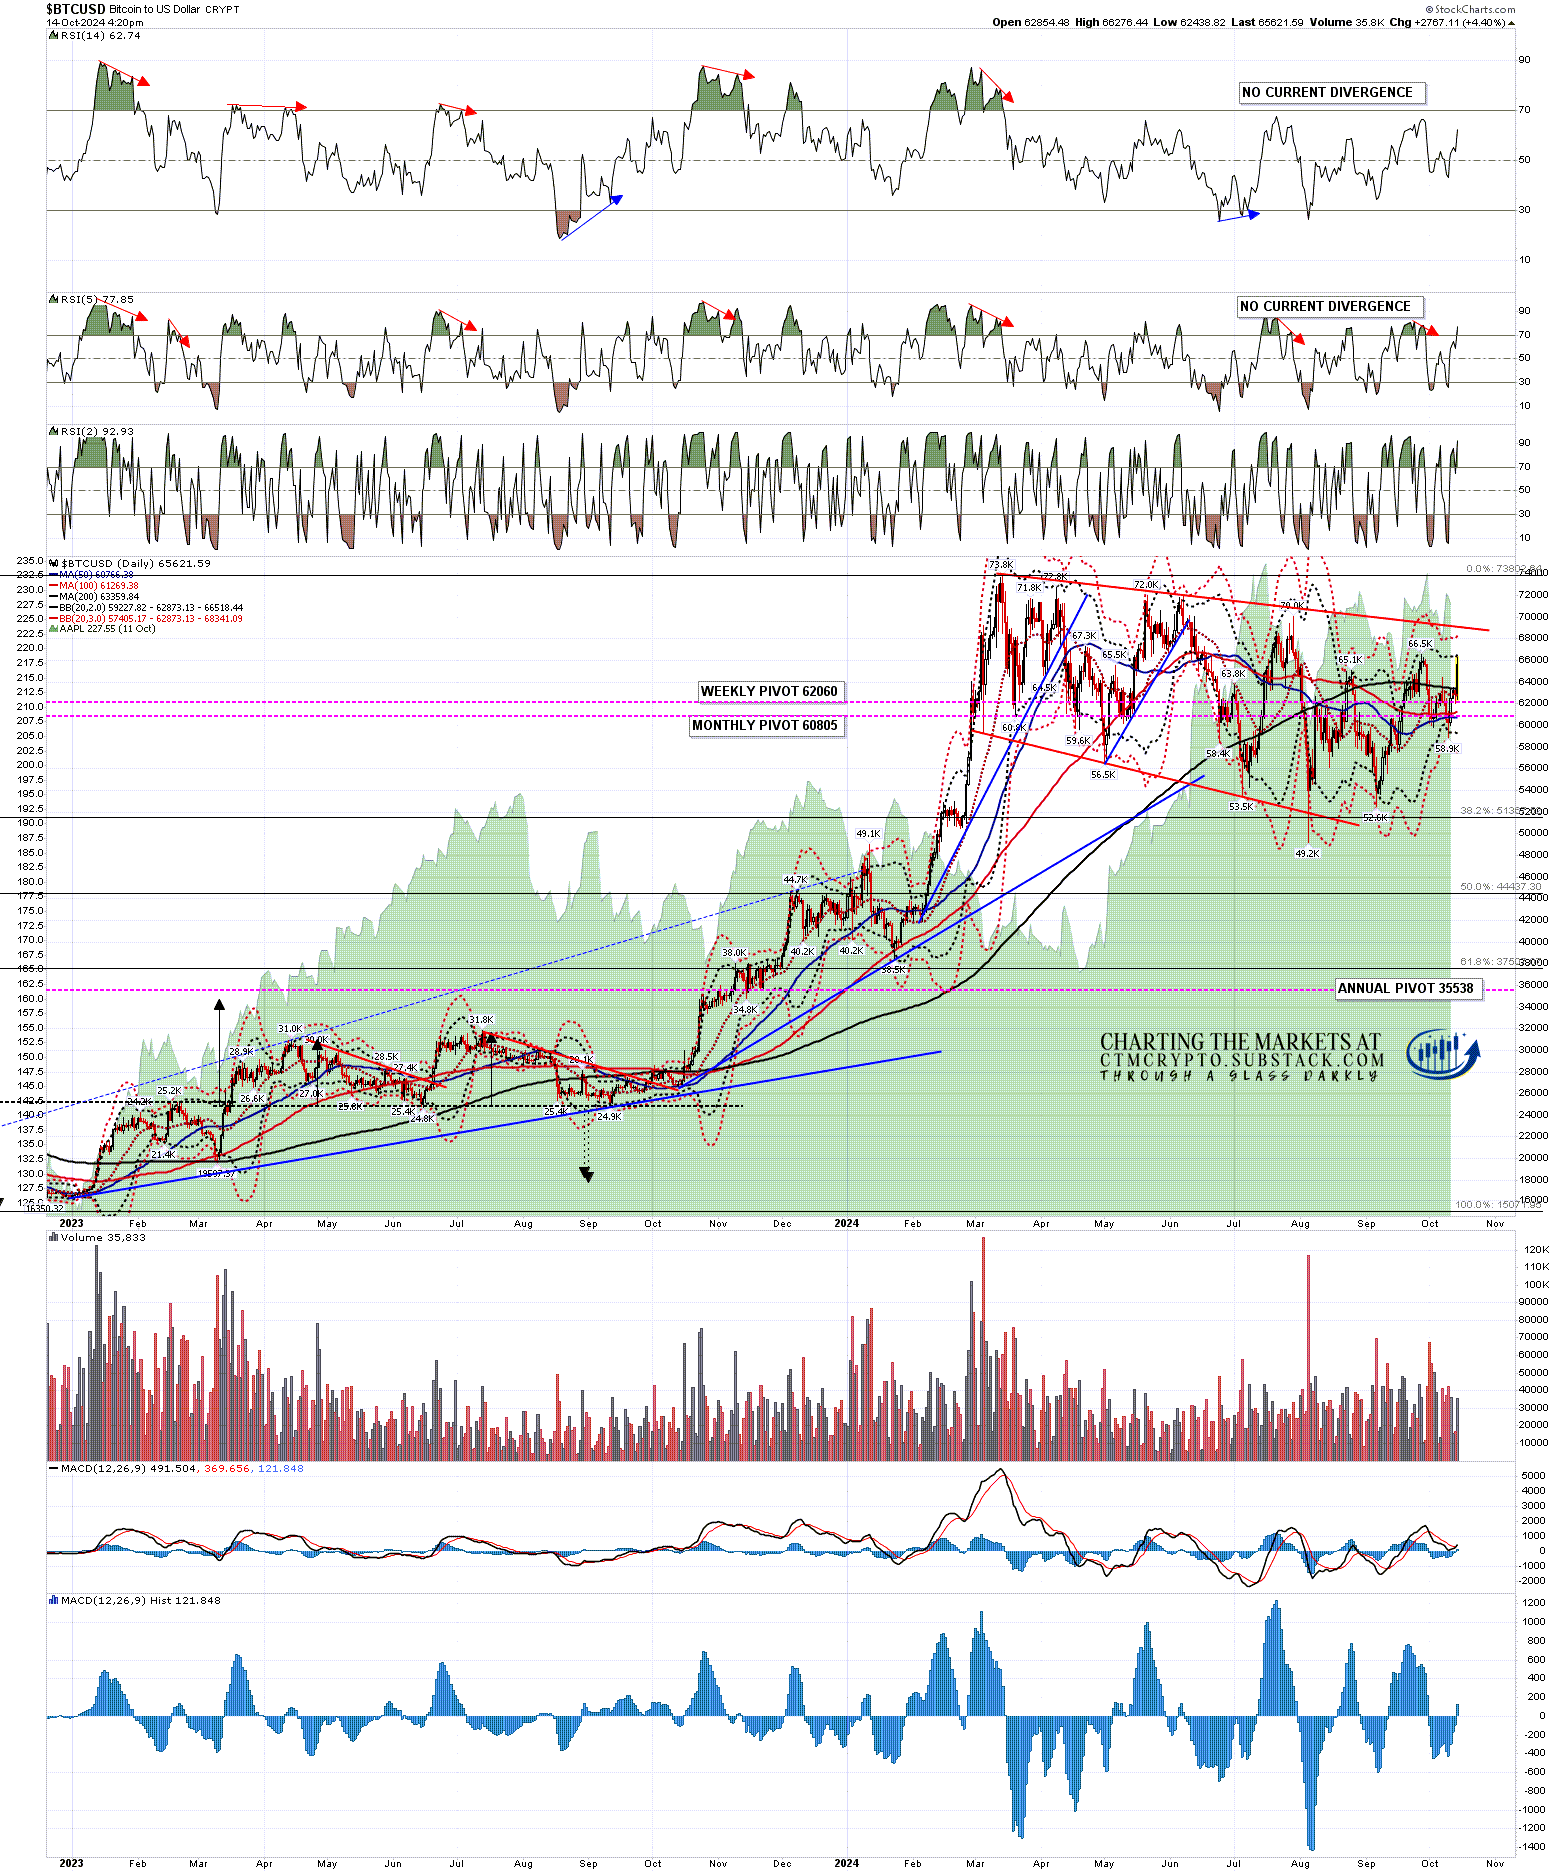
On the bigger picture the overall setup is a likely much larger bull flag and the most bearish aspect of the Crypto charts when I was writing on Friday was that the daily middle bands were continuing to hold as resistance, though that has now changed.
Now the break above the daily middle bands has to hold for a couple of days for the daily middle band to convert to support, but so far this looks like a conviction break which on Bitcoin has also been a conviction break over the 200dma. On a move back over 66.5k, the obvious next big target would be larger bull flag resistance, currently in the 69k area.
BTCUSD daily chart:
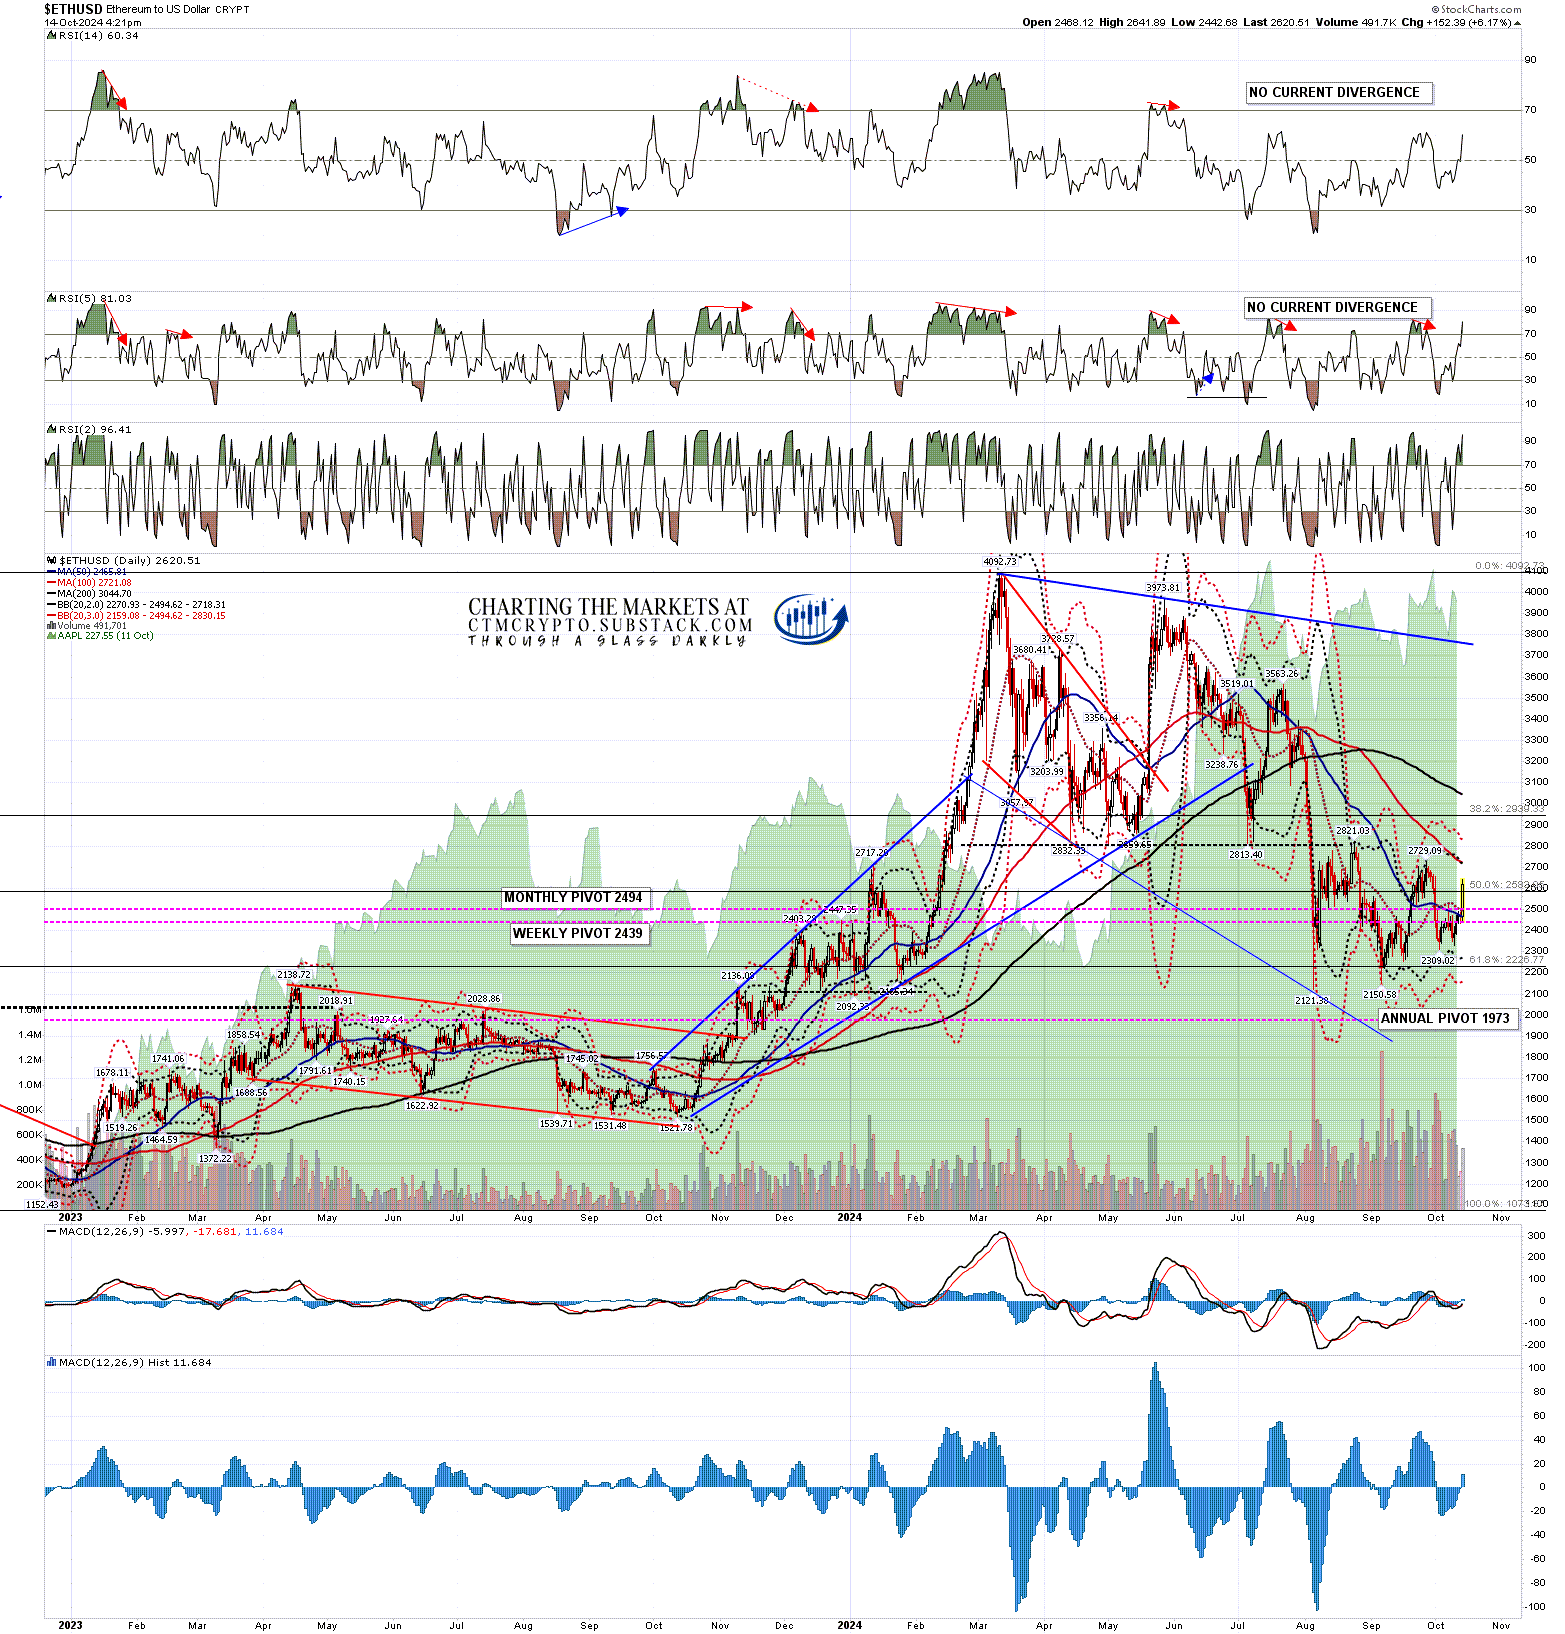
On Ethereum (ETHUSD) there is no bull flag target, but the move today is a hard break over the 50dma and daily middle band. On a move higher the next big targets would be the 200dma, currently at 3045, and declining resistance from the 2024 high at 4092.73, currently in the 3720 area.
I would note that the obvious bigger picture patterns forming on here on Bitcoin and Solana (SOLUSD) are bull flags. That’s not as clear on Ethereum, which may have deeper issues and underperform both of the others in the longer term.
ETHUSD daily chart:
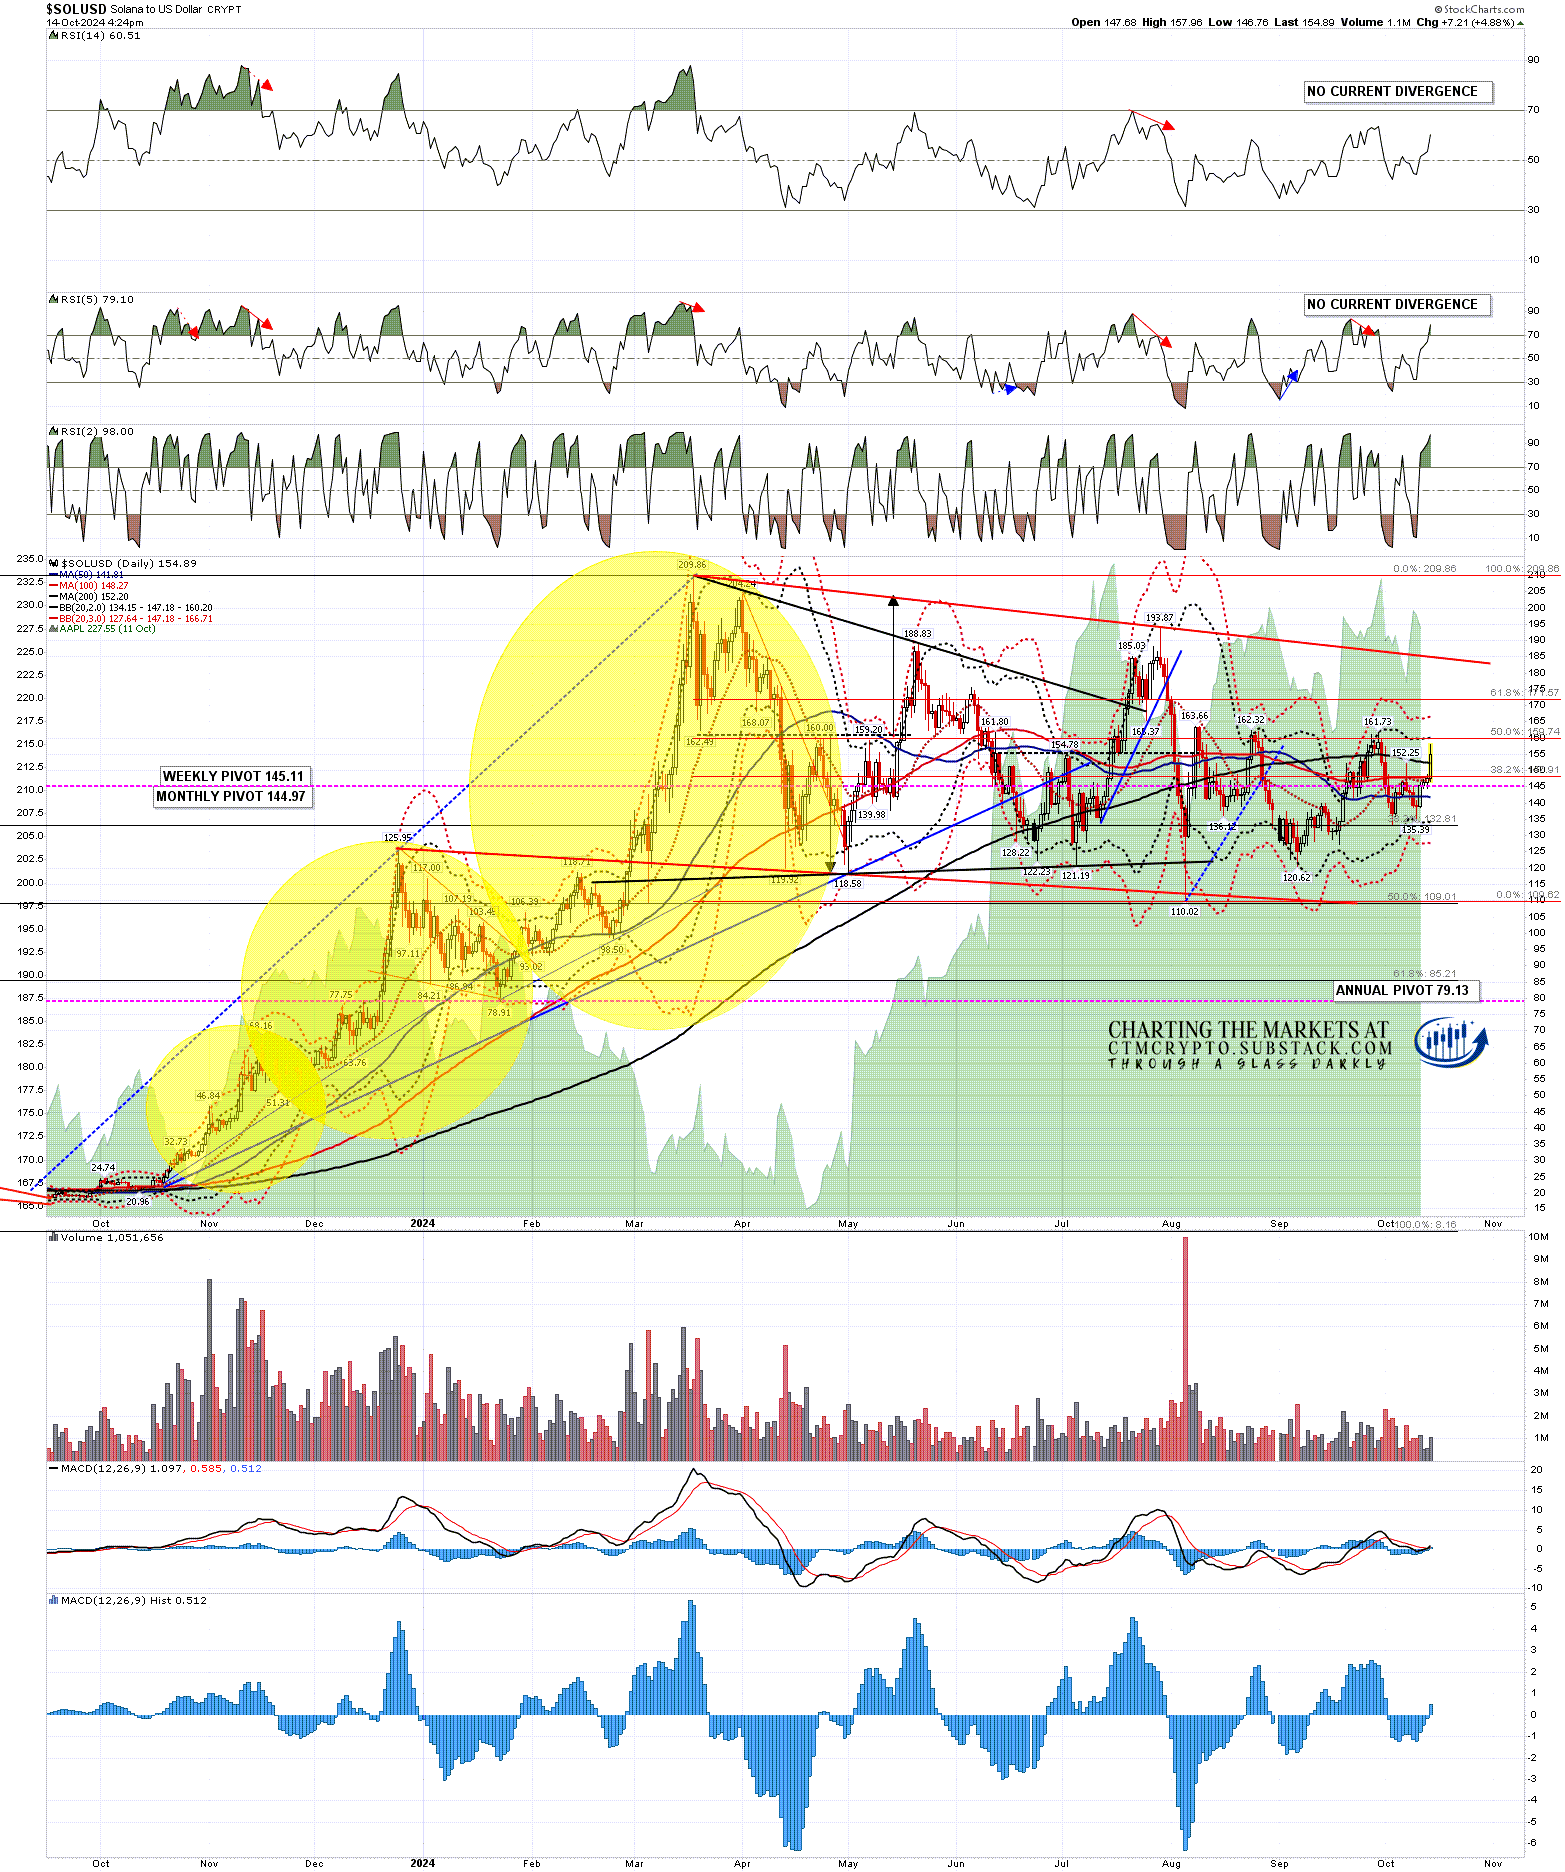
Solana has also broken back hard over the daily middle band and less so the 200dma, currently at 152.20. The obvious next target would be a retest of the September high at 161.73 and, above that, larger bull flag resistance now in the 185 area.
SOLUSD daily chart:
I was saying on Friday that on the bigger picture Crypto was likely setting up for another bull move. That move has likely now started, and if Bitcoin and Solana can break up from their overall bull flag setups, then those targets would then be a retest of the all time high on Bitcoin at 73.8k, and a retest of the 2024 high on Solana at 209.86.
Given the correlation between Crypto on equities, what does this suggest about prospects for equity markets? Well, nothing that could be interpreted as bearish.
If you’d like to see more of these posts and the other Crypto videos and information I post, please subscribe for free to my Crypto substack.
I’m also to be found at Arion Partners, though as a student rather than as a teacher. I’ve been charting Crypto for some years now, but am learning to trade and invest in them directly, and Arion Partners are my guide around a space that might reasonably be compared to the Wild West in one of their rougher years.

