
I’ve started to change on shorter term charts to using SPY rather than SPX, QQQ rather than NDX and DIA rather than Dow as I’ve got the impression that would be more useful for most people. Feedback very welcome if anyone has a view on this.
I was saying on Thursday last week that I wasn’t expecting to see anything particularly impressive on the downside, but there were three decent rising wedges from the August lows on SPX, NDX and Dow that I’ve been watching, and a couple of short term double tops that might play out. That’s still mostly the case so I thought I’d do a quick update post on that today.
On SPX/SPY there is a high quality rising wedge from the August low and on the obvious resistance trendline the obvious read is a bearish overthrow of the highs. If we see more downside then the rising wedge support trendline, currently at 571, could be the target, and there is a good quality possible double top in place that on a sustained break below 578.54 would look for a target in the 571 to 571.75 area, a decent match with that rising support trendline.
SPY 15min chart:
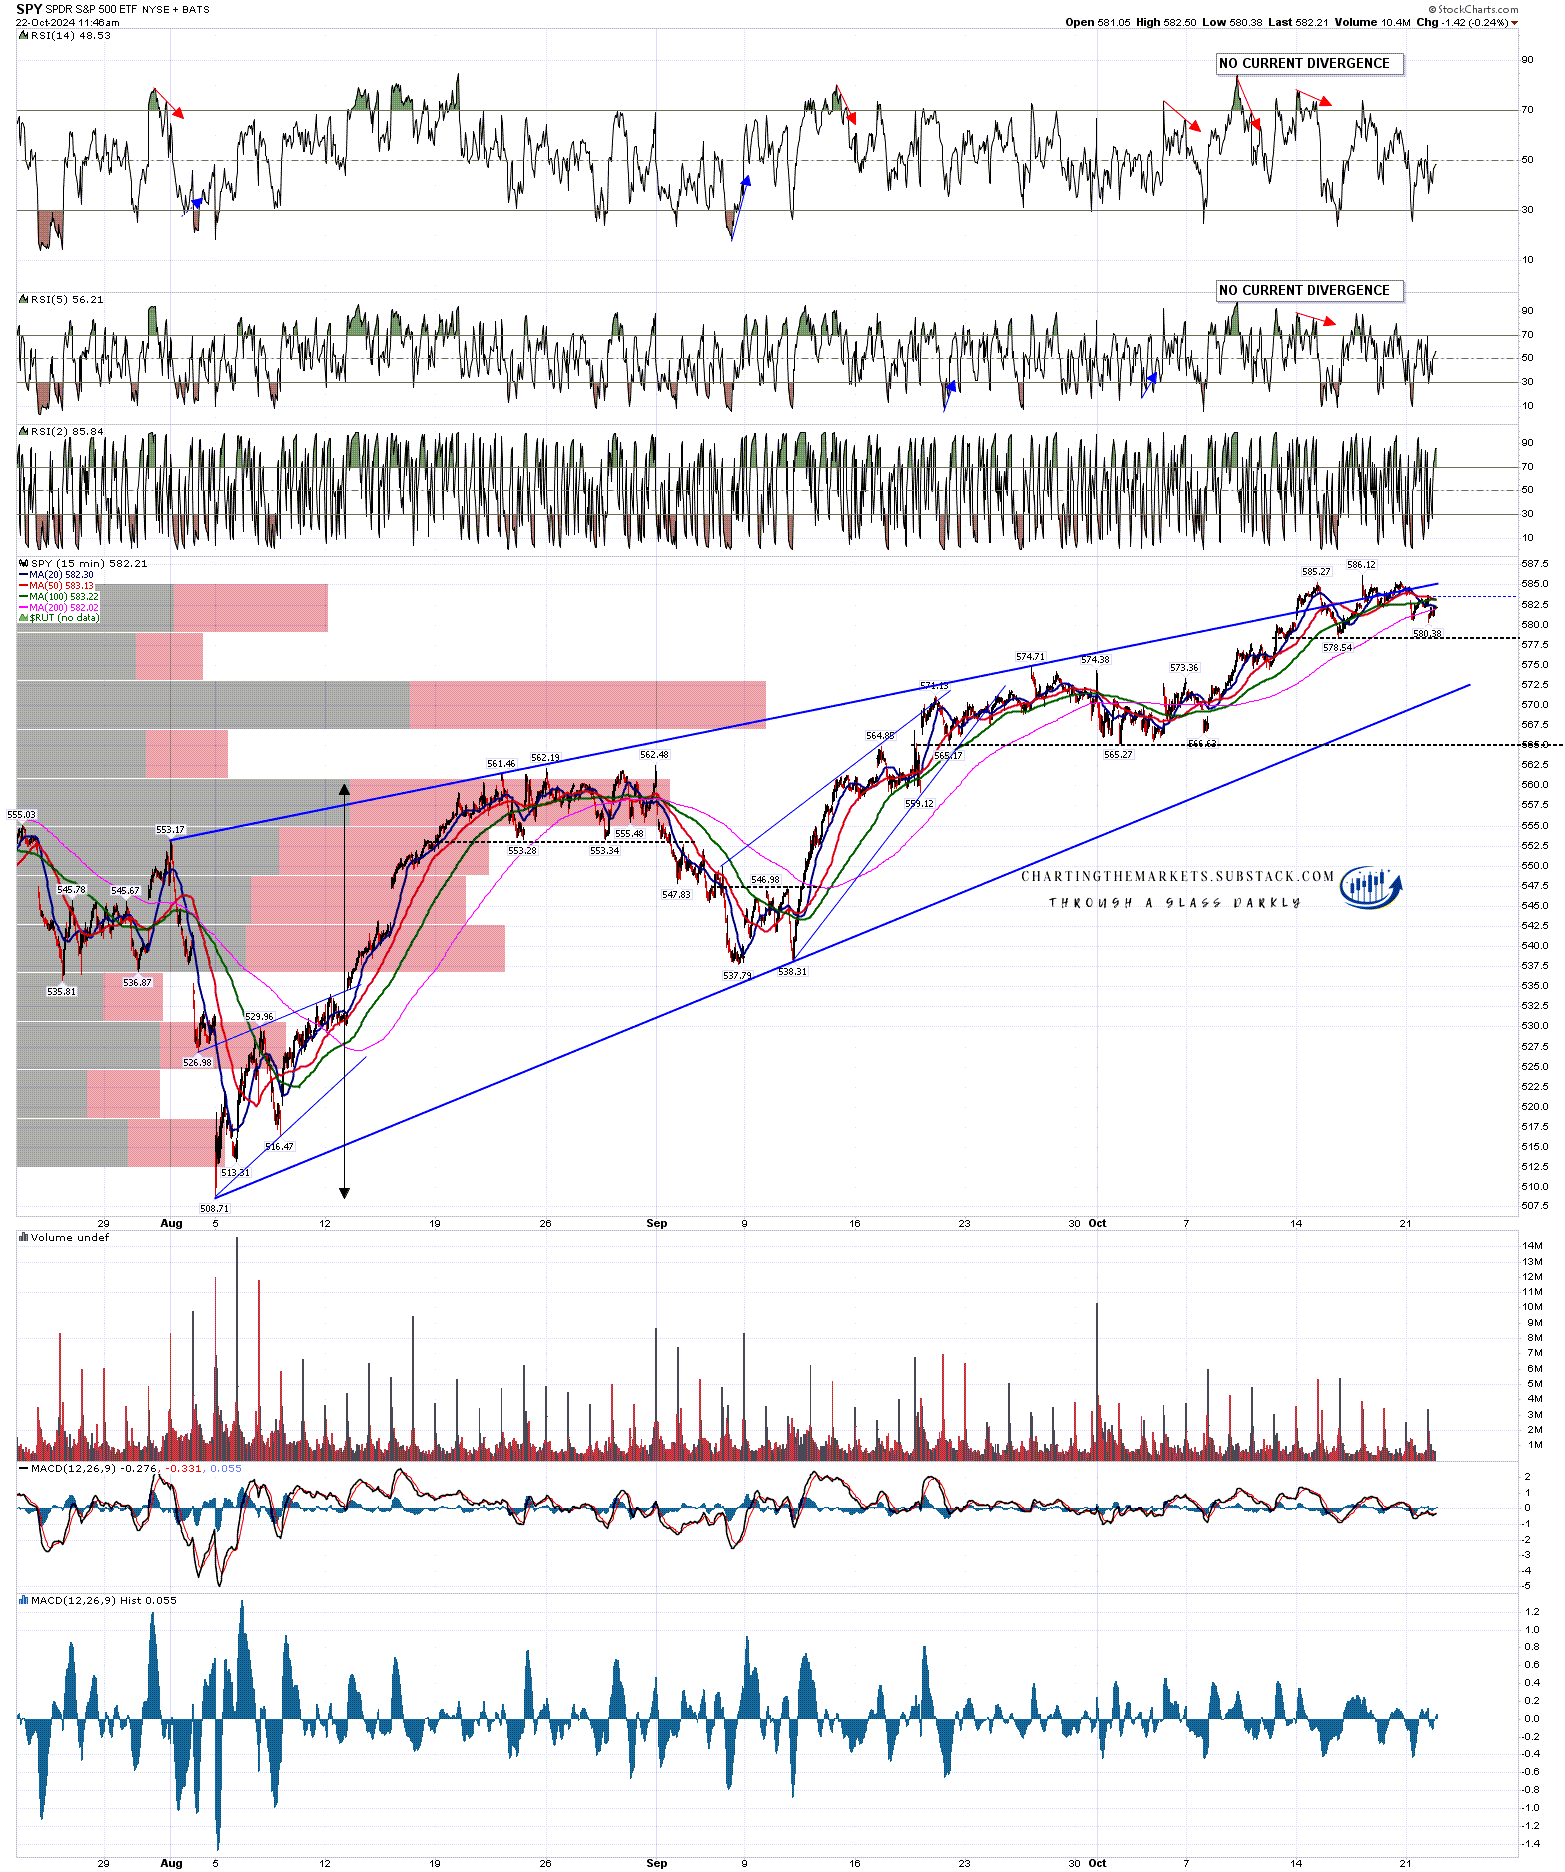
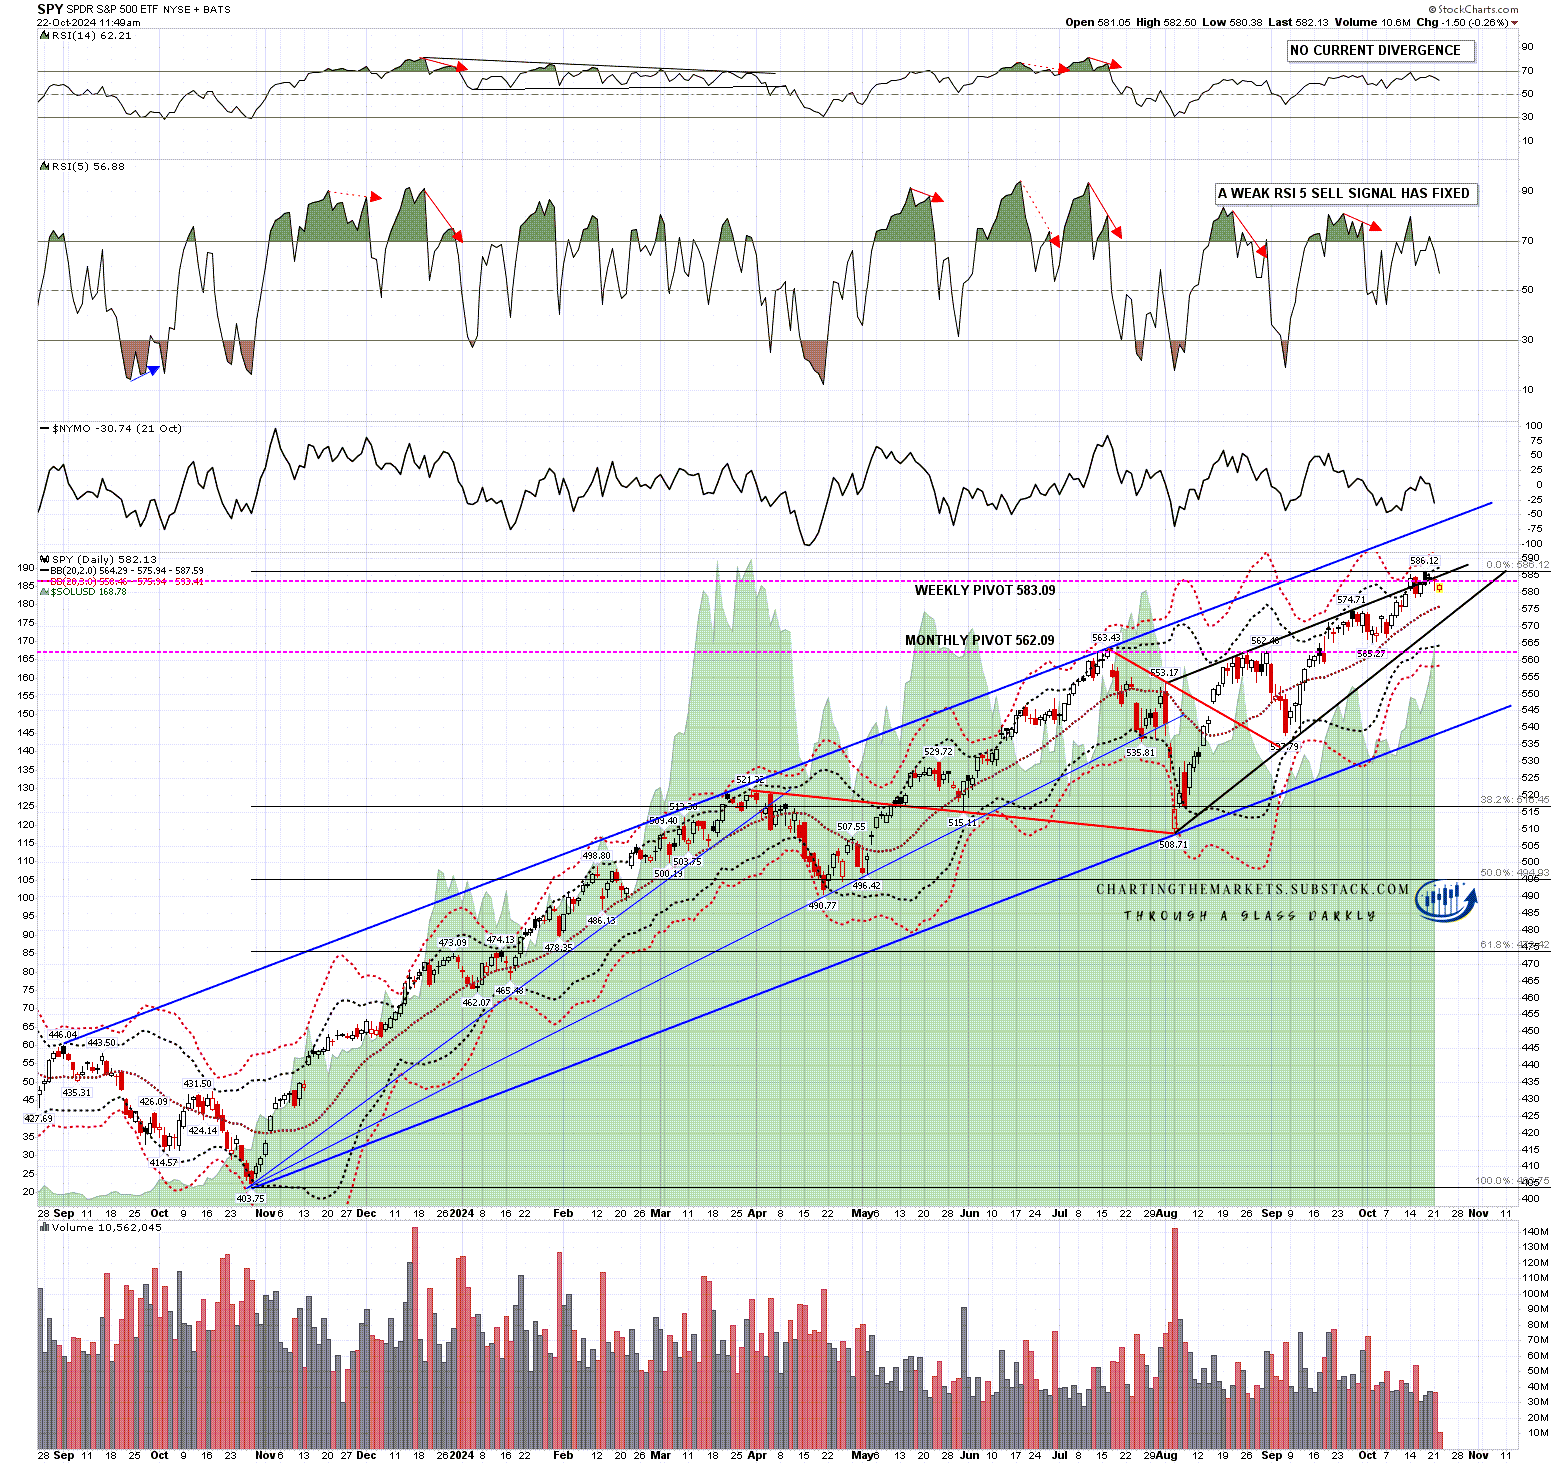
In the event that we do see more downside I’d be watching the daily middle band, currently in the 576 area. A break and conversion of that would make any possible larger downside scenarios look more interesting.
SPY daily chart:
On NDX/QQQ there is another high quality rising wedge from the August low and on the obvious resistance trendline the obvious read is a slight bearish overthrow of the highs. There is no obvious short term topping setup here, but rising wedge support is currently in the 481 area.
QQQ 15min chart:
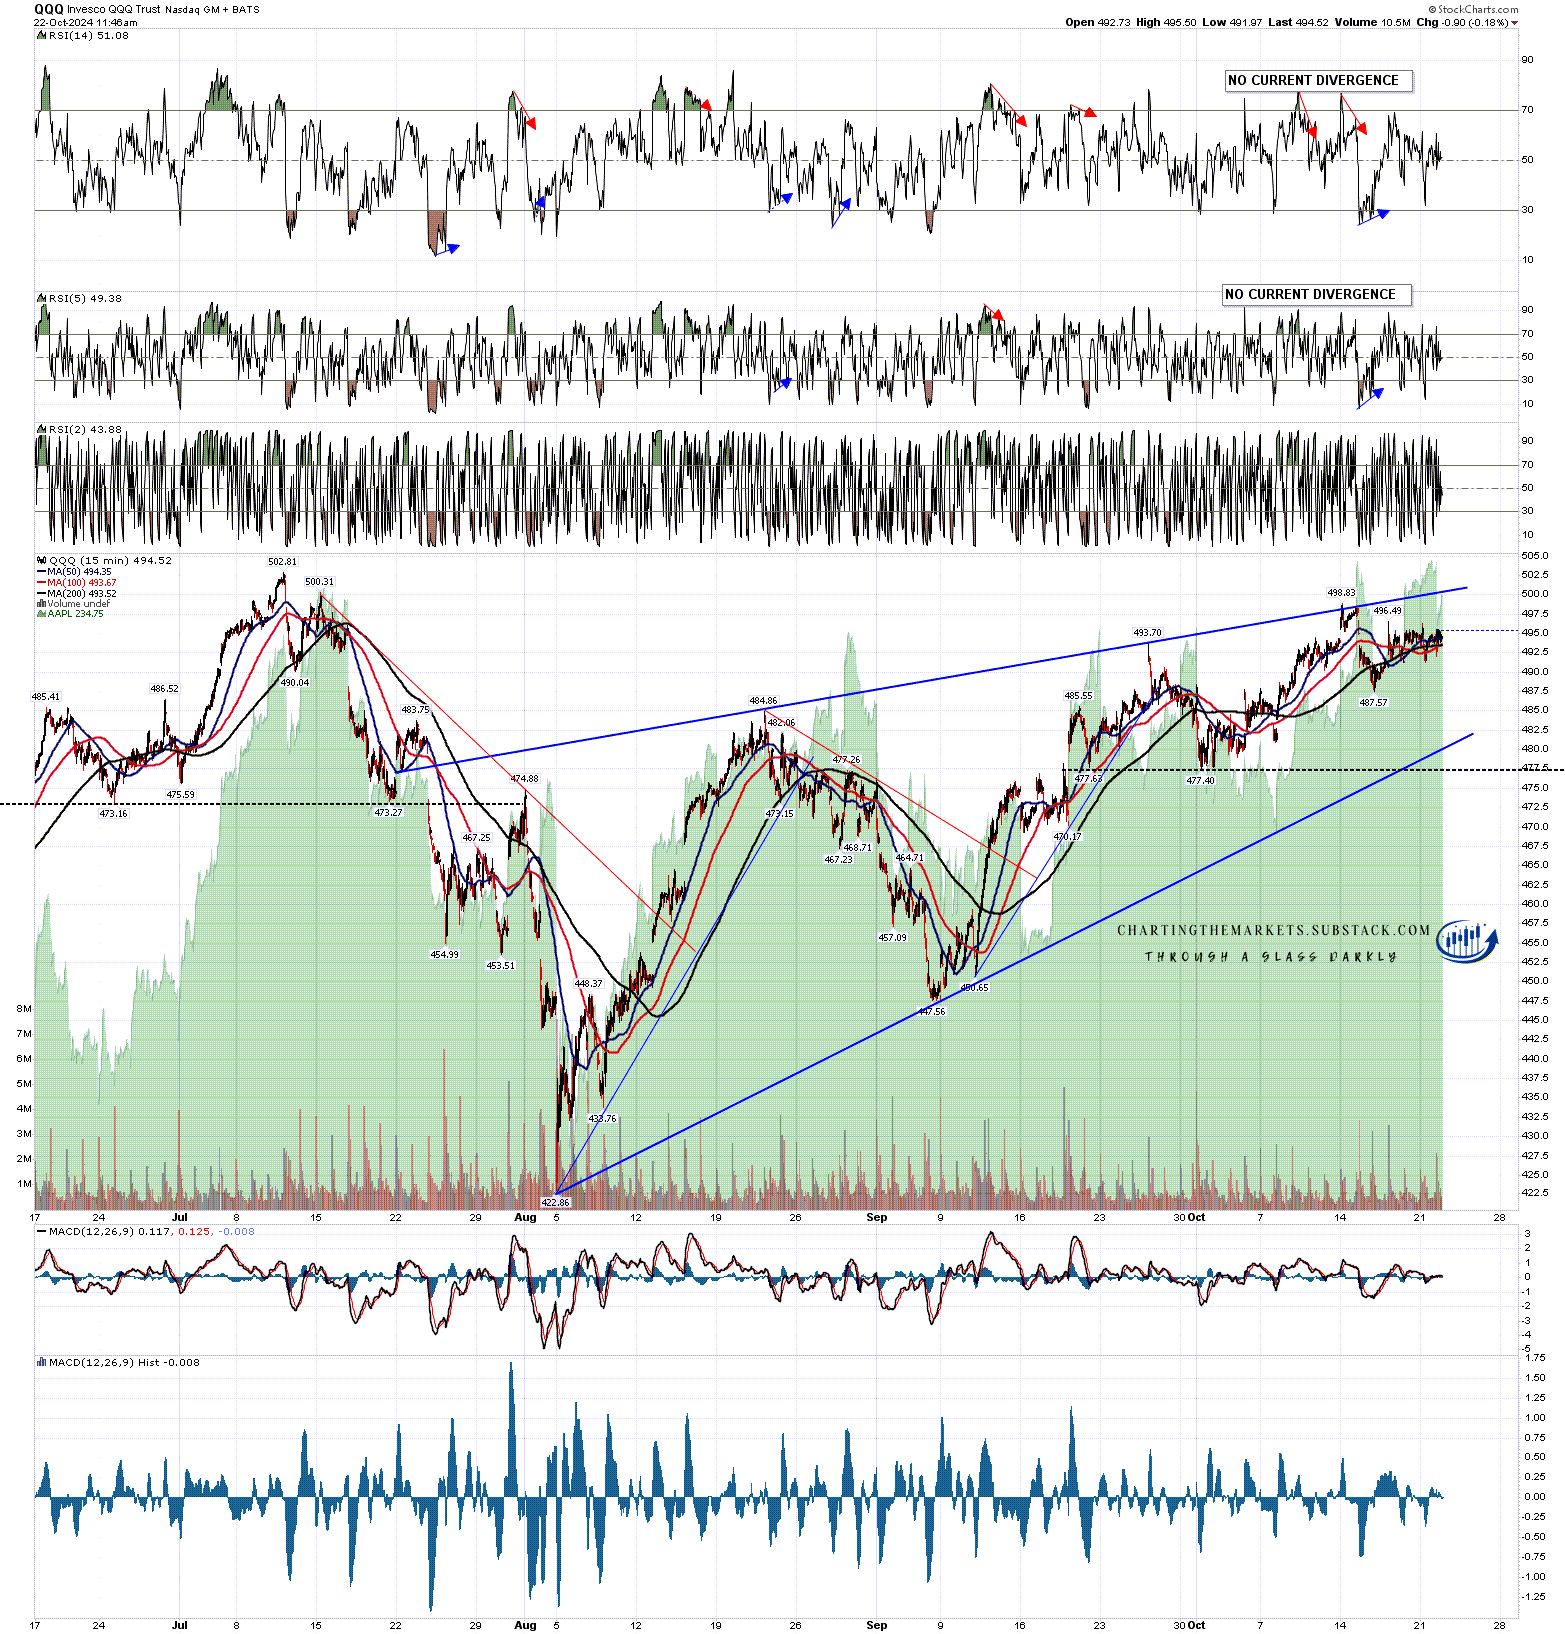
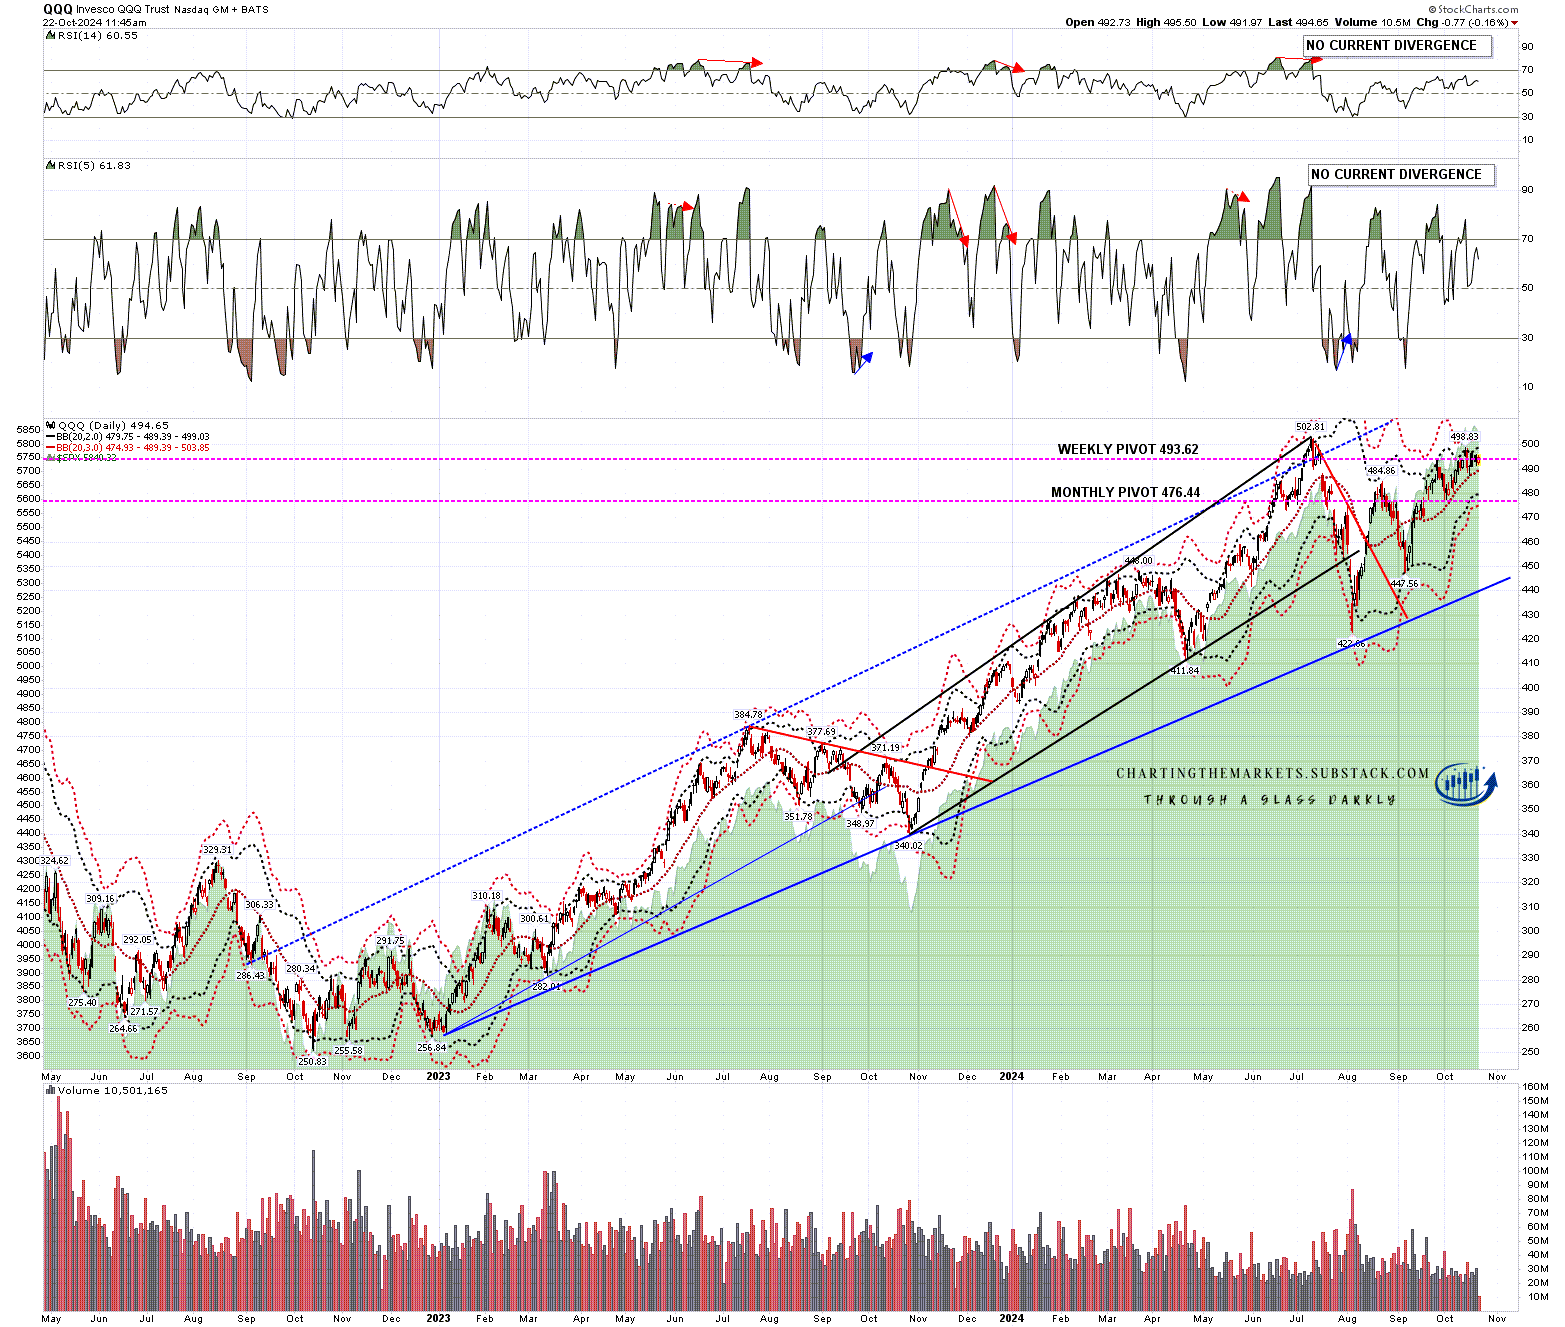
If we see more downside on QQQ then I’ll be watching the daily middle band, currently in the 489.5 area, as that has been tested three times since mid-September and has held as a low each time. If that should be broken with any confidence that would also give some more credibility to any larger downside scenarios.
QQQ daily chart:
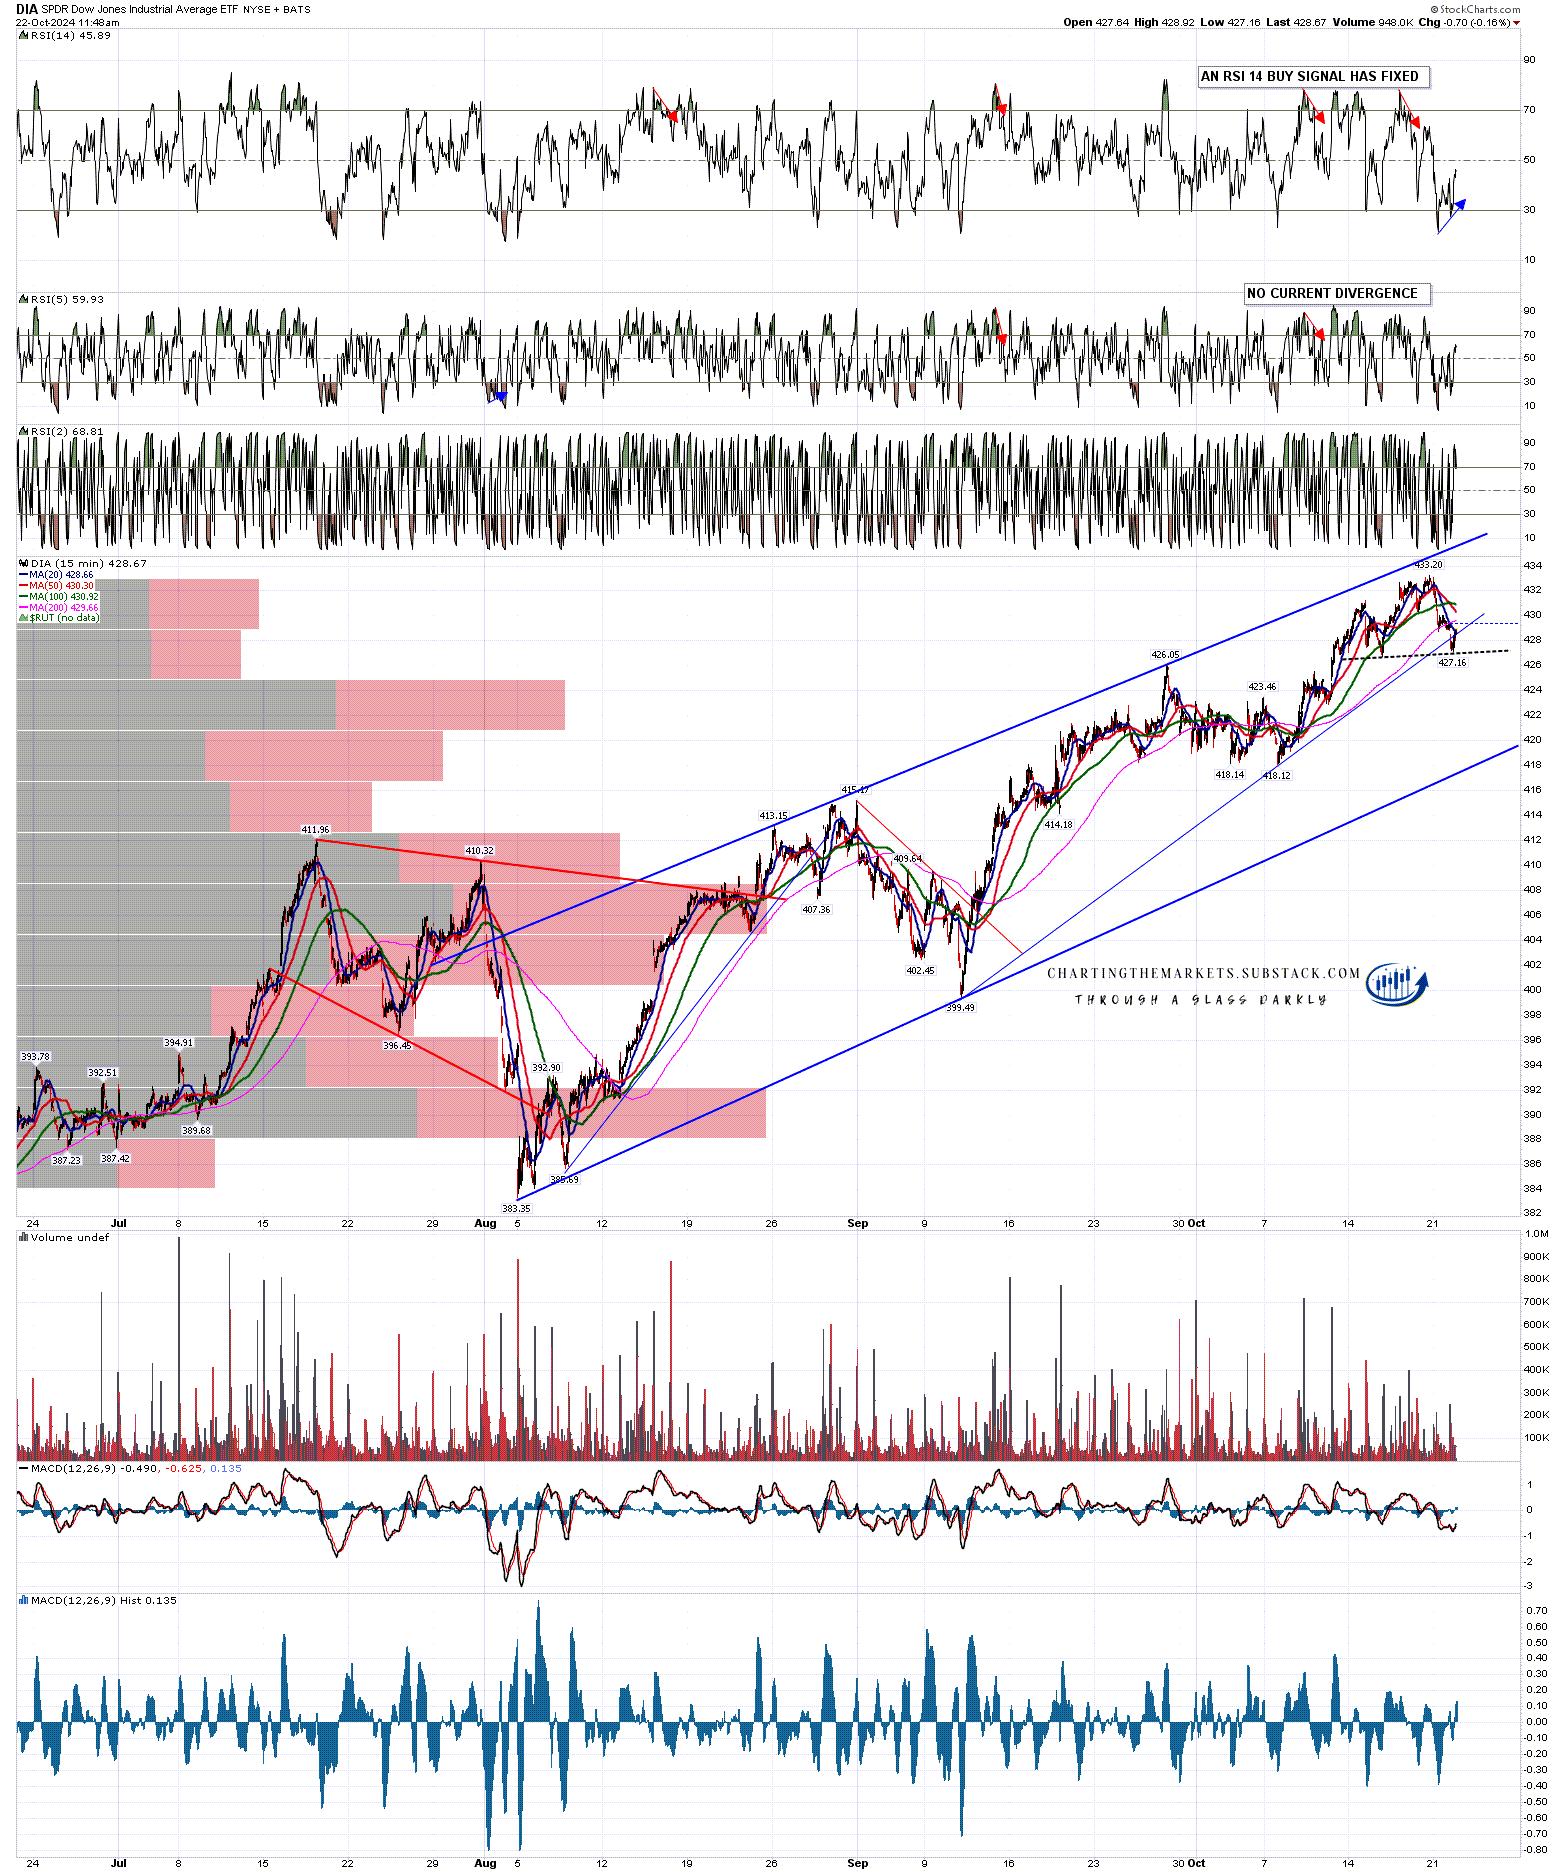
On Dow/DIA there is another high quality rising wedge from the August low and on this one the rising trendline has been hit but not broken. The next obvious target within the wedge would be wedge support, currently in the 417.50 area. A very small double top has already broken down and reached target and a possible larger H&S could be forming here. If that breaks down here then the H&S target would be in the 420-1 area.
On this 15min chart an RSI 14 buy signal has fixed, supporting a modest rally here to form that right shoulder. If seen, the ideal right shoulder high would be in the 431 area.
DIA 15min chart:
Overall I’m still not looking for much interesting to happen on the downside over the next few days but there are still open daily RSI 5 sell signals on SPY and DIA, and if there wasn’t already one fixed on DIA, a new one would have fixed yesterday. There is a setup here where we can see some more downside this week, but not much to suggest that would get far.
If you like my analysis and would like to see more, please take a free subscription at my chartingthemarkets substack, where I publish these posts first and do a short premarket review every morning.
