
There is a significant discrepancy between Crypto and US equities at the moment, which is casting some doubt on short term direction, though on the bigger picture it seems likely that we are seeing bull flags form on Crypto and the next big move will likely be up.
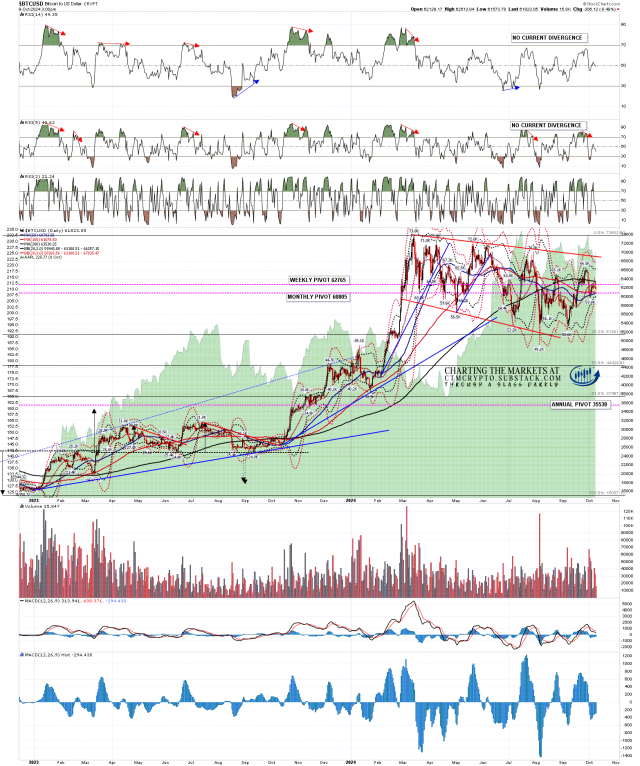
On the Bitcoin (BTCUSD) daily chart the daily middle band has been backtested and is holding as resistance, so the current trend still leans down.
BTCUSD daily chart:
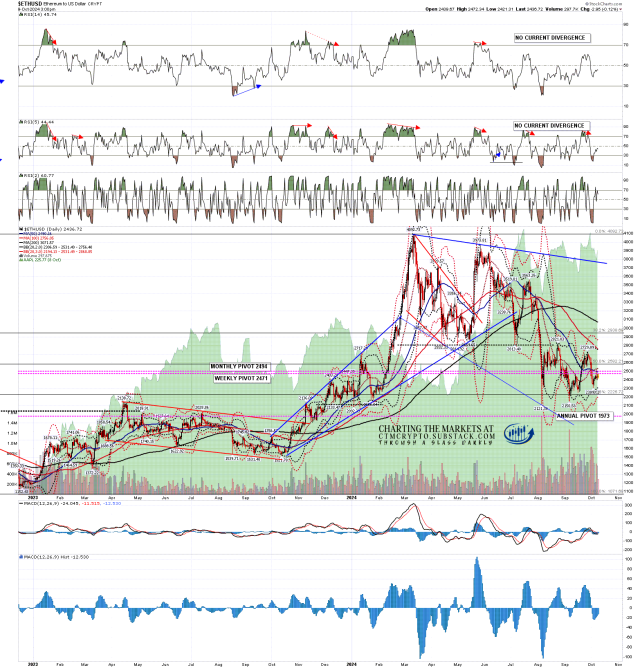
On the Ethereum (ETHUSD) daily chart the daily middle band has been backtested and is holding as resistance, so the current trend still leans down.
ETHUSD daily chart:
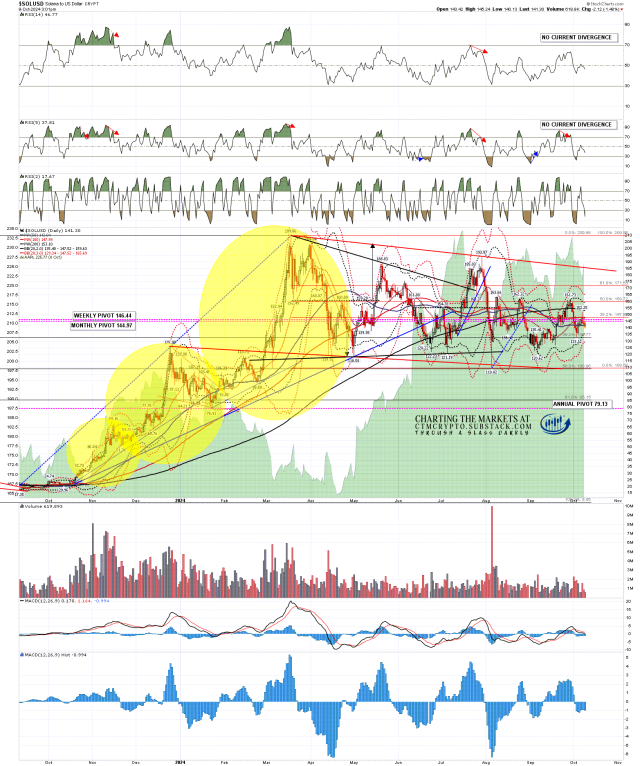
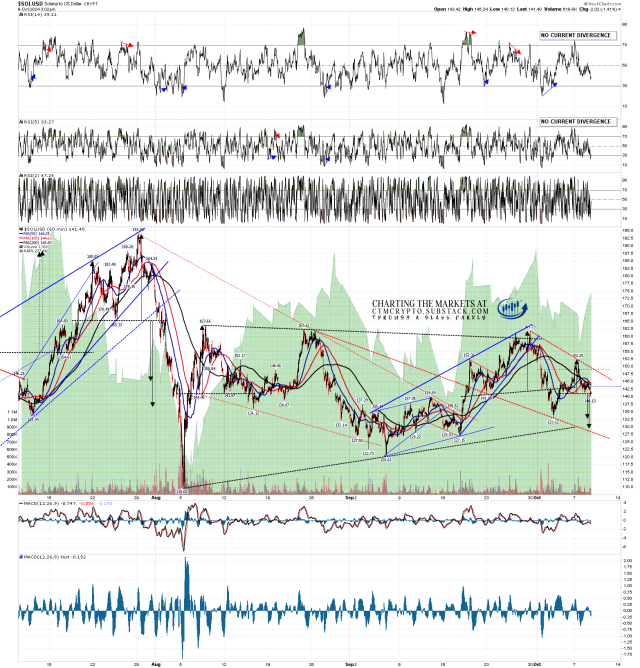
On the Solana (SOLUSD) daily chart the daily middle band has been backtested and is holding as resistance, so the current trend still leans down.
Obviously Crypto is in sharp short term contrast with US equity indices here, as SPX, NDX & Dow are all currently holding their daily middle bands as support, but I’ve favoring at least some more downside coming on equities this month, so I’m treating this as a transition period before a likely overall bullish trend reasserts itself on both.
SOLUSD daily chart:
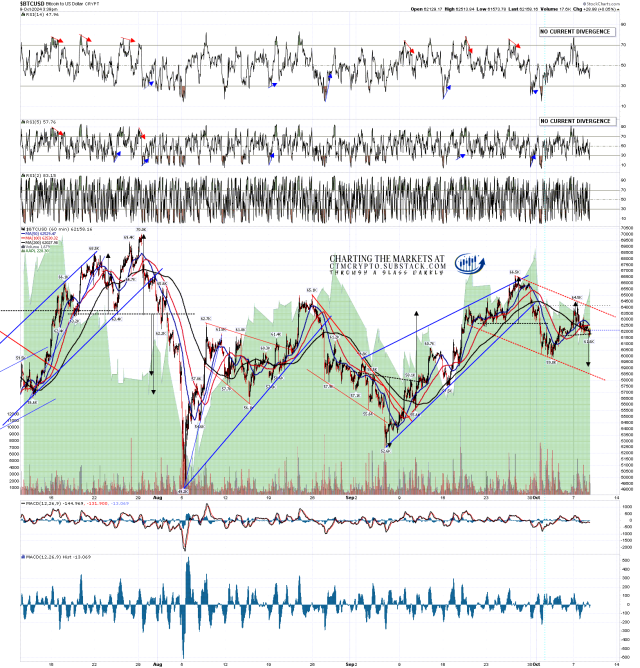
In the short term the decent quality H&S that had formed on Bitcoin failed with a move over the right shoulder high, and that fixes a target at a retest of September high at 66.5k.
We might still be forming bull flag to get there though, and I drew the best option for that in yesterday’s premarket video. The possible bull flag channel for that is currently in the 58,500 area and since then an ok but not great quality H&S has formed and broken down with a target in the 59,000 area. No support sell signals but an attractive setup.
If Bitcoin gets back into the 58-59k area, I’ll be leaning towards that being a buy opportunity.
BTCUSD 60min chart:
On Solana there is a parallel setup, not with a bull flag in this instance, but a possible falling wedge that I drew in yesterday morning, with wedge support currently in the 128.5 area, and a good quality H&S that has since formed and broken down with a target first at a retest of the last low at 133.12, then an extended target in the 129.5 area.
I would note on Solana though that until we see a break over the August high at 162.32 there is a possible overall bearish triangle forming here, and if that turns out to be the case, then that triangle target would be a minimum retest of the August low at 110.02. I’m not thinking that this is necessarily a triangle forming, but the possibility is in the mix here.
SOLUSD 60min chart:
On the bigger picture Crypto is likely setting up for another bull move. In the short term the daily middle bands on Bitcoin, Ethereum and Solana are all currently still holding as resistance, and there is a decent setup to see some more downside. If seen, I’ll be looking for possible decent buy setups to form.
If you’d like to see more of these posts and the other Crypto videos and information I post, please subscribe for free to my Crypto substack.
I’m also to be found at Arion Partners, though as a student rather than as a teacher. I’ve been charting Crypto for some years now, but am learning to trade and invest in them directly, and Arion Partners are my guide around a space that might reasonably be compared to the Wild West in one of their rougher years.

