
In mid-September I wrote a post looking at a big inflection point on equities, and the large decline we could see from there on the pattern setup. Let’s see how that’s looking now.
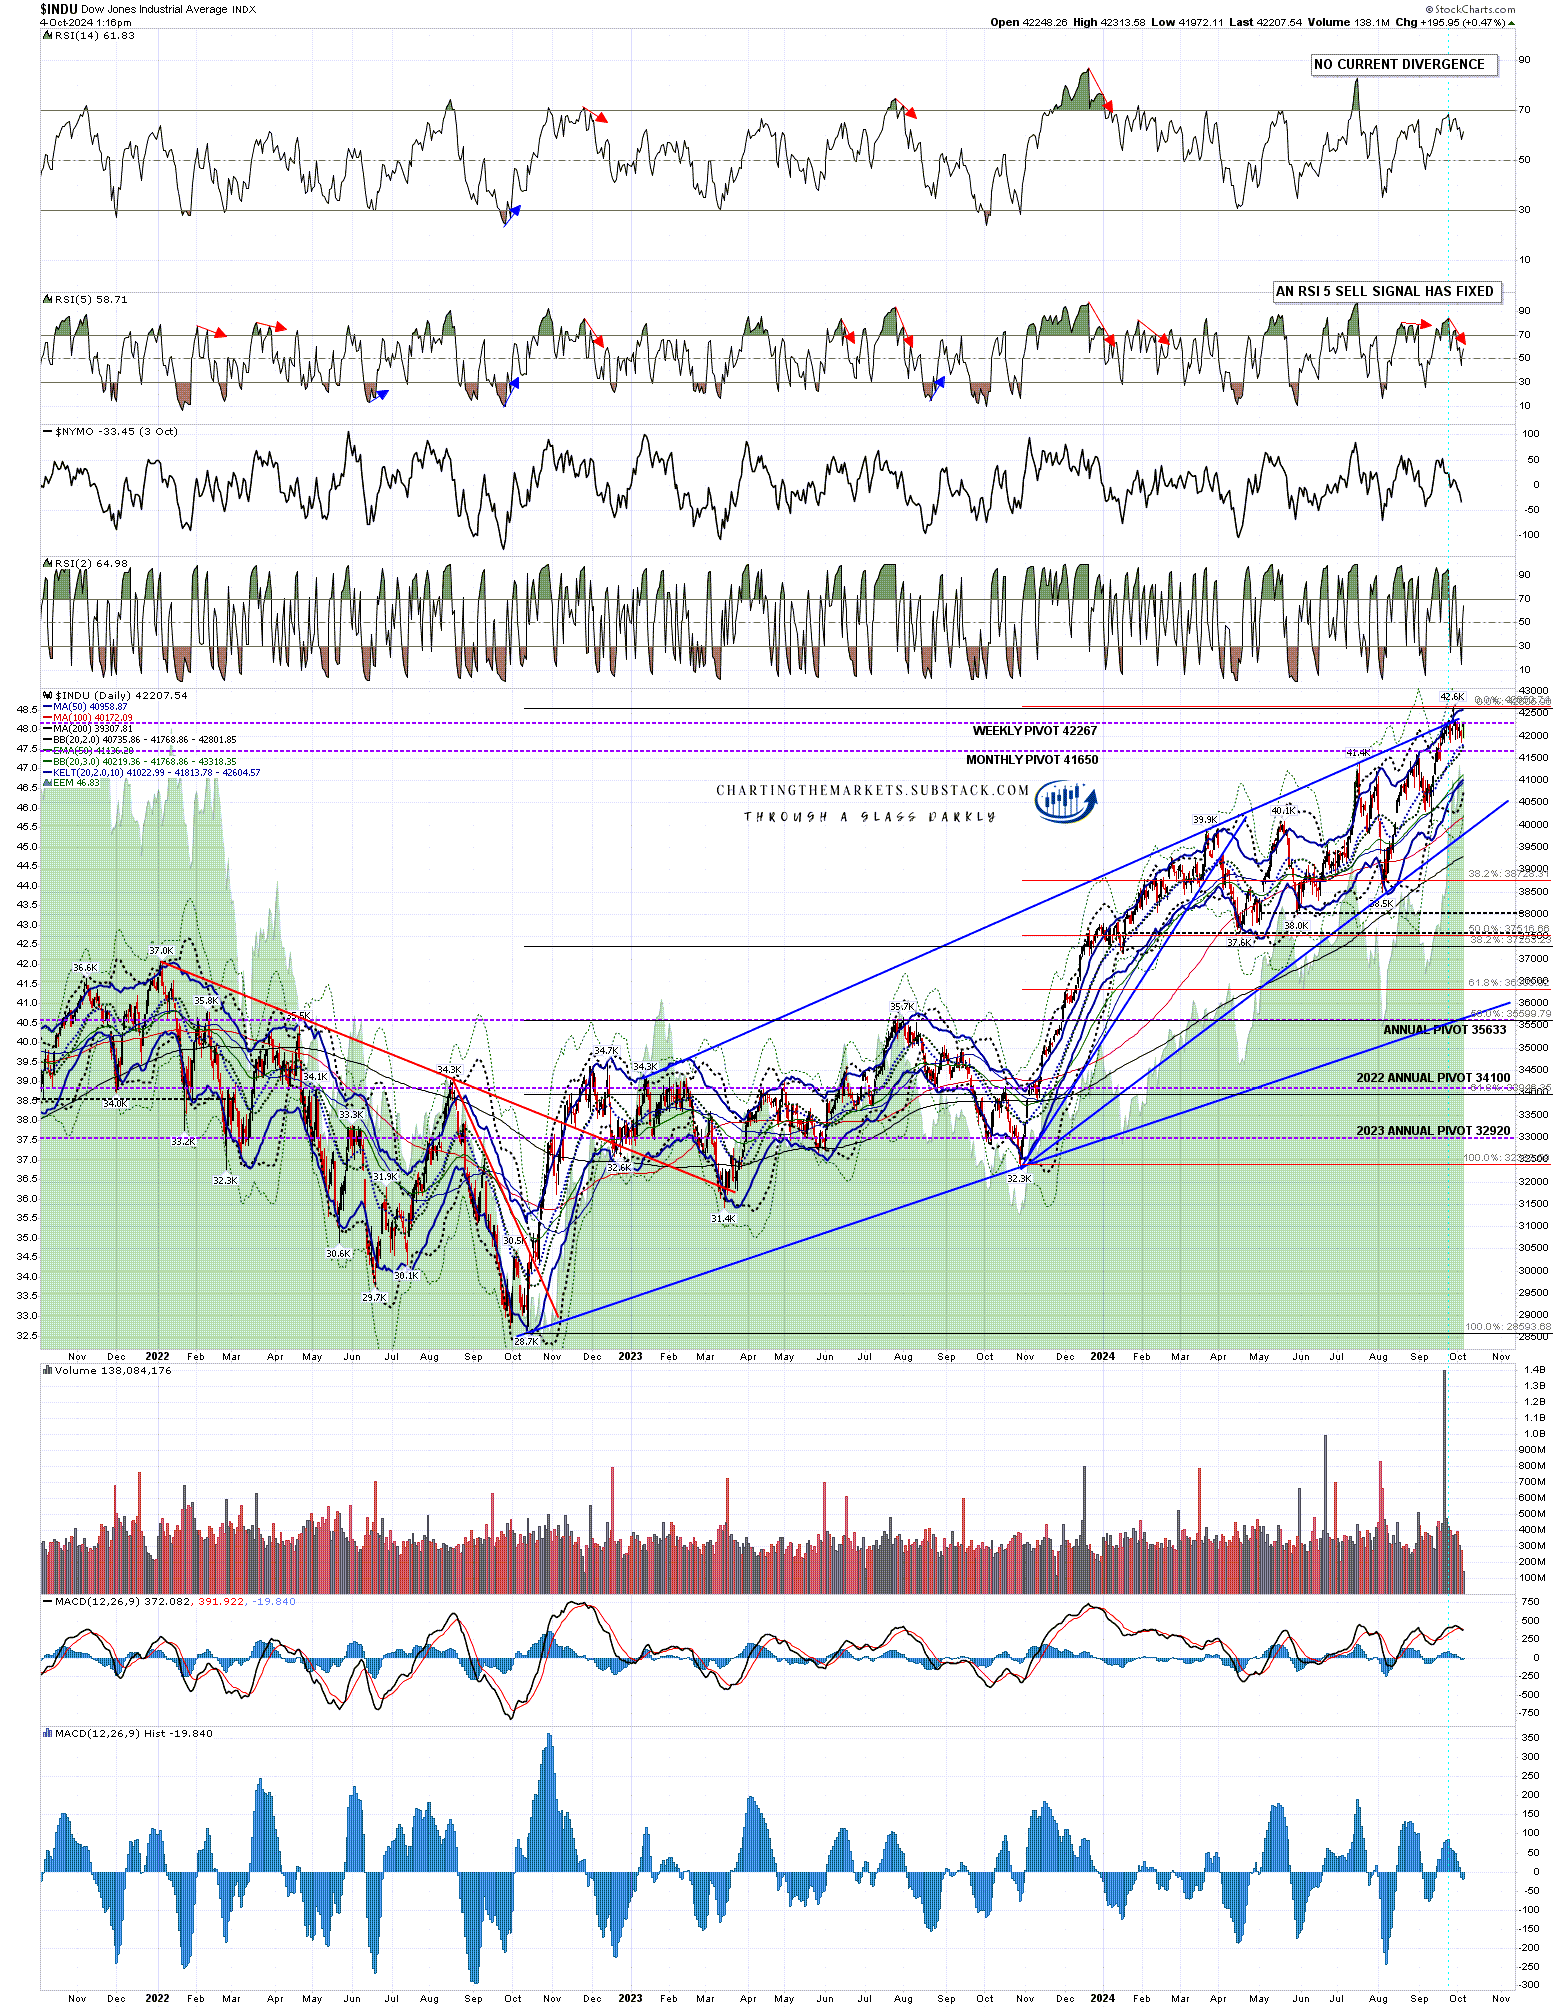
There were two big nested double top setups that had formed on Dow and SPX. The first of those was on Dow and that has gone high enough since to destroy the setup. While that has happened though Dow has established a high quality rising wedge from the Oct 2023 low that is holding so far, and that has wedge support currently in the 40,000 area.
In the meantime a daily RSI 5 sell signal has fixed and is not close to target. Eight of these signals have fixed in the last three years and all of those have reached target. The odds favor this one making target too, so my lean is that we have at least some more downside coming, and wedge support at 40,000 is a possible target for that move.
INDU daily chart:
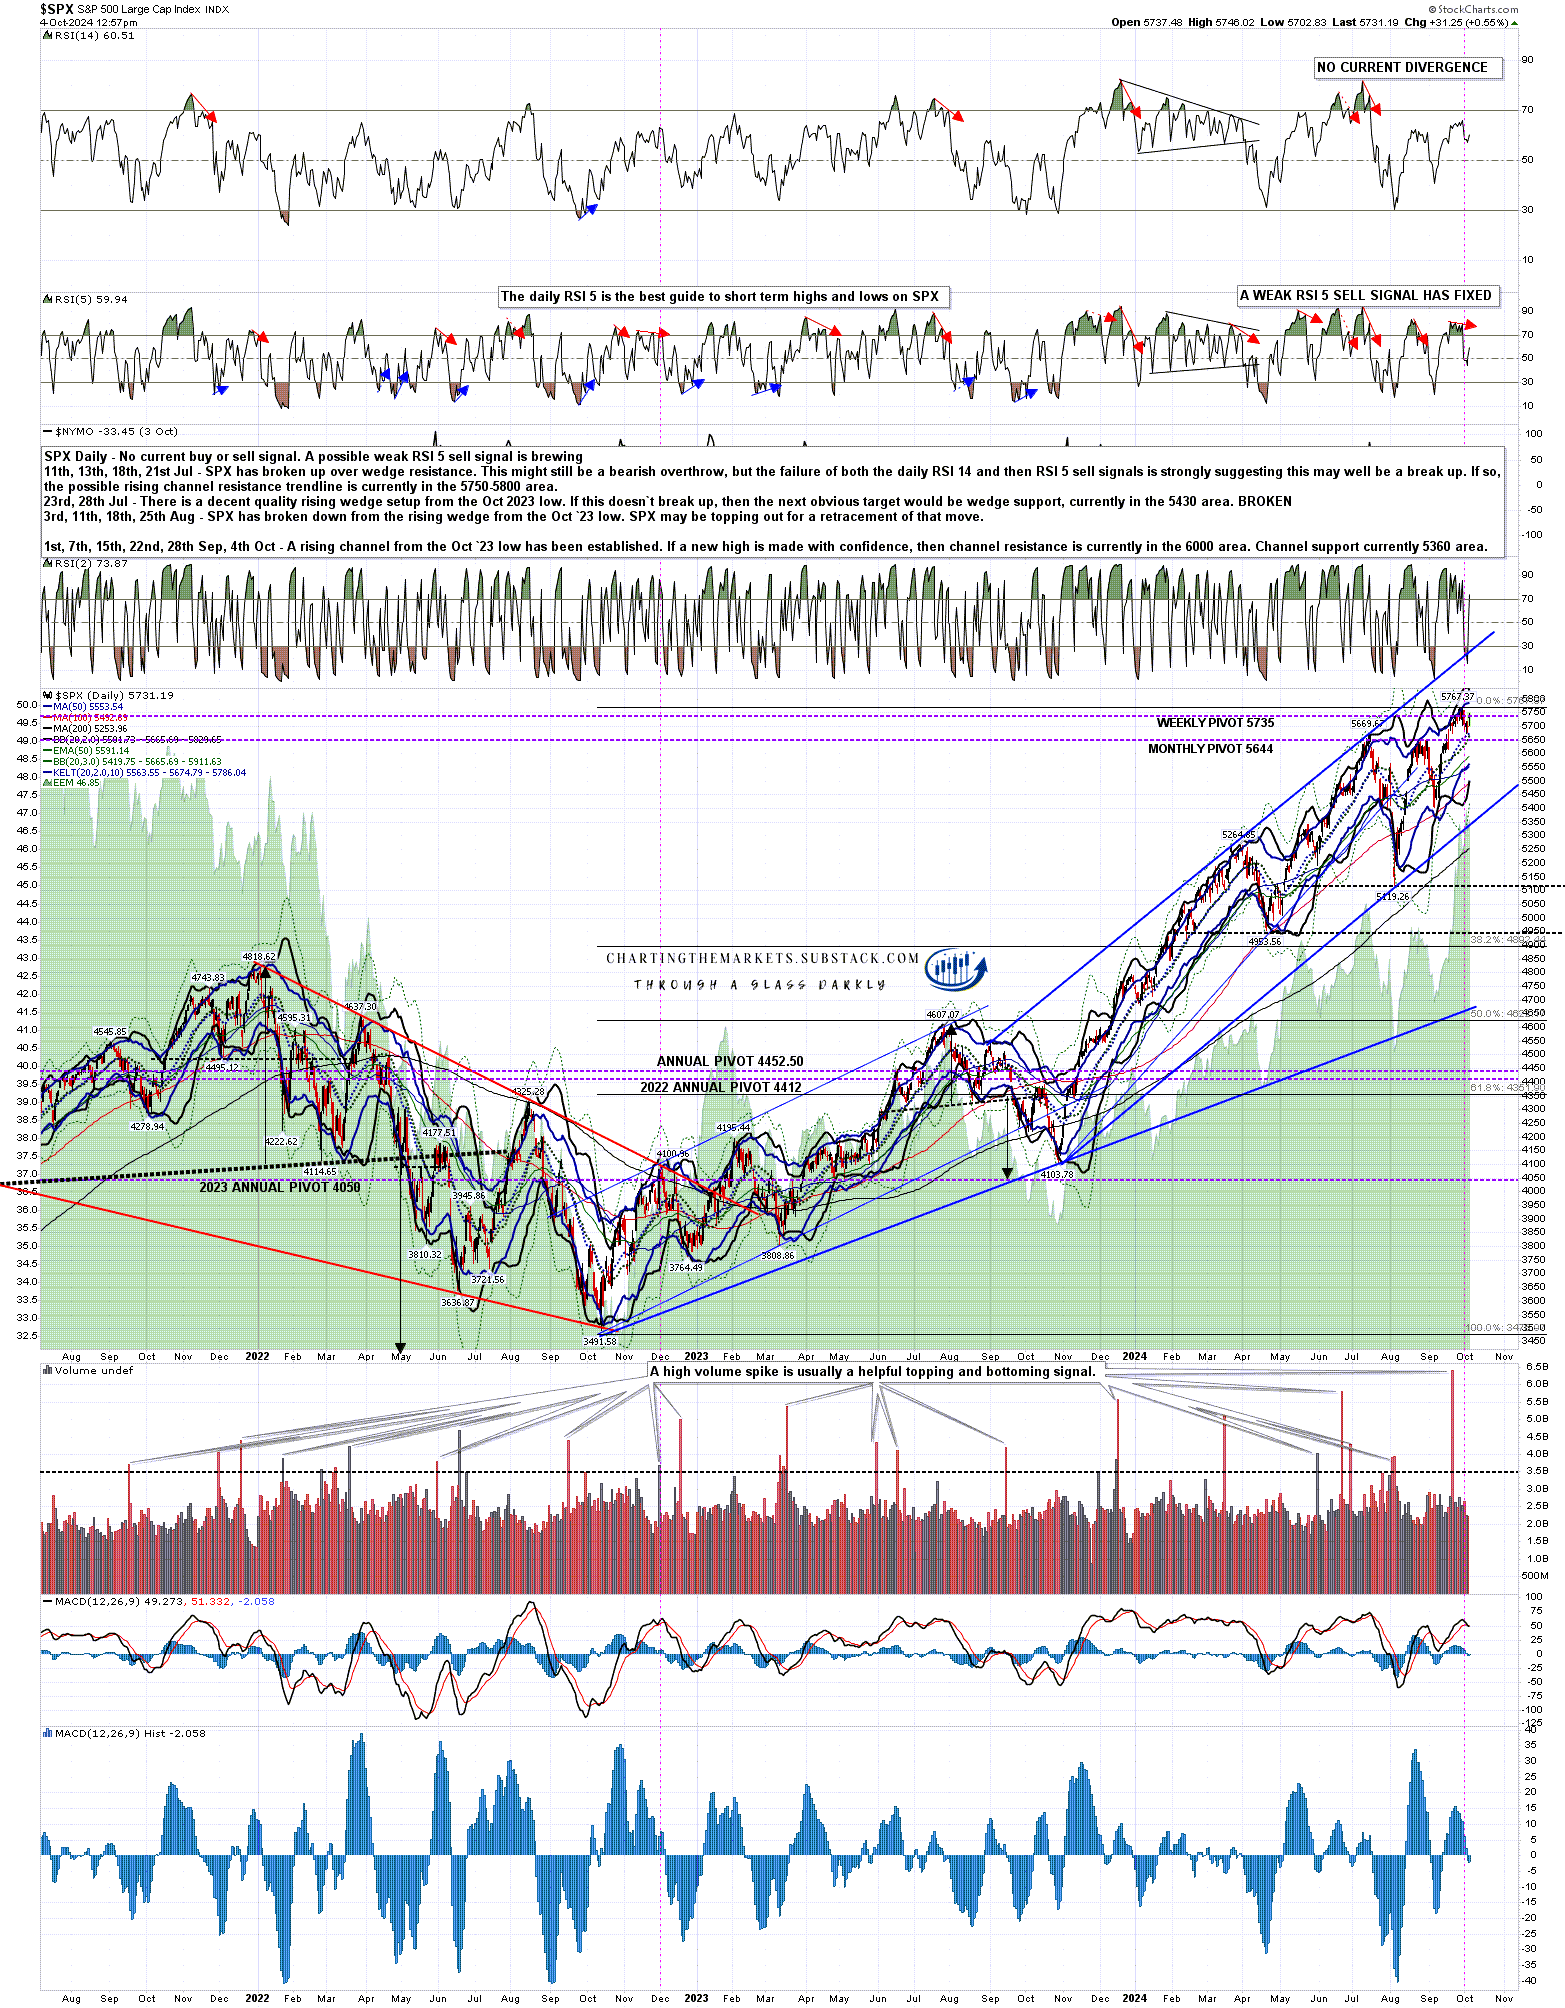
The second possible nested double top setup I was looking at was on SPX. That has not been as thoroughly destroyed as the one on Dow, but the smaller double top setup is gone, and the larger double top setup is no longer anything like as nice. I’m disregarding that for now.
No new resistance trendline has been established on SPX on the daily chart and the trending pattern setup remains the same, in a rising channel from the October 2023 low, with channel support now in the 5360 area and channel resistance now in the 6000 area. The next obvious target within the channel is channel resistance now in the 6000 area (and rising), so if we make a decent low in October and see a bull run into Xmas, then that is the main target area that I will be watching.
As with Dow a daily RSI 5 sell signal has fixed, though a weak one in this case, and the track record for these is decent, though not as good as on Dow. Thirteen of these have fixed previously in the last three years, three of them weak, and ten of those made at least the possible near miss target, including all the weak ones. This is still a good track record, and the odds here also favor this signal reaching target.
There are two other factors to consider here, those being the hit on the 30 level on the SPXADP daily chart I was talking about in that post, and the volume spike shortly after that post that was the highest such spike in the last three years. Both are a good signal for at minimum of two or three week consolidation, but obviously that was over two weeks ago. These are only a weak indicator for more sideways or down action at this point, so are no longer really in the mix.
SPX daily chart:
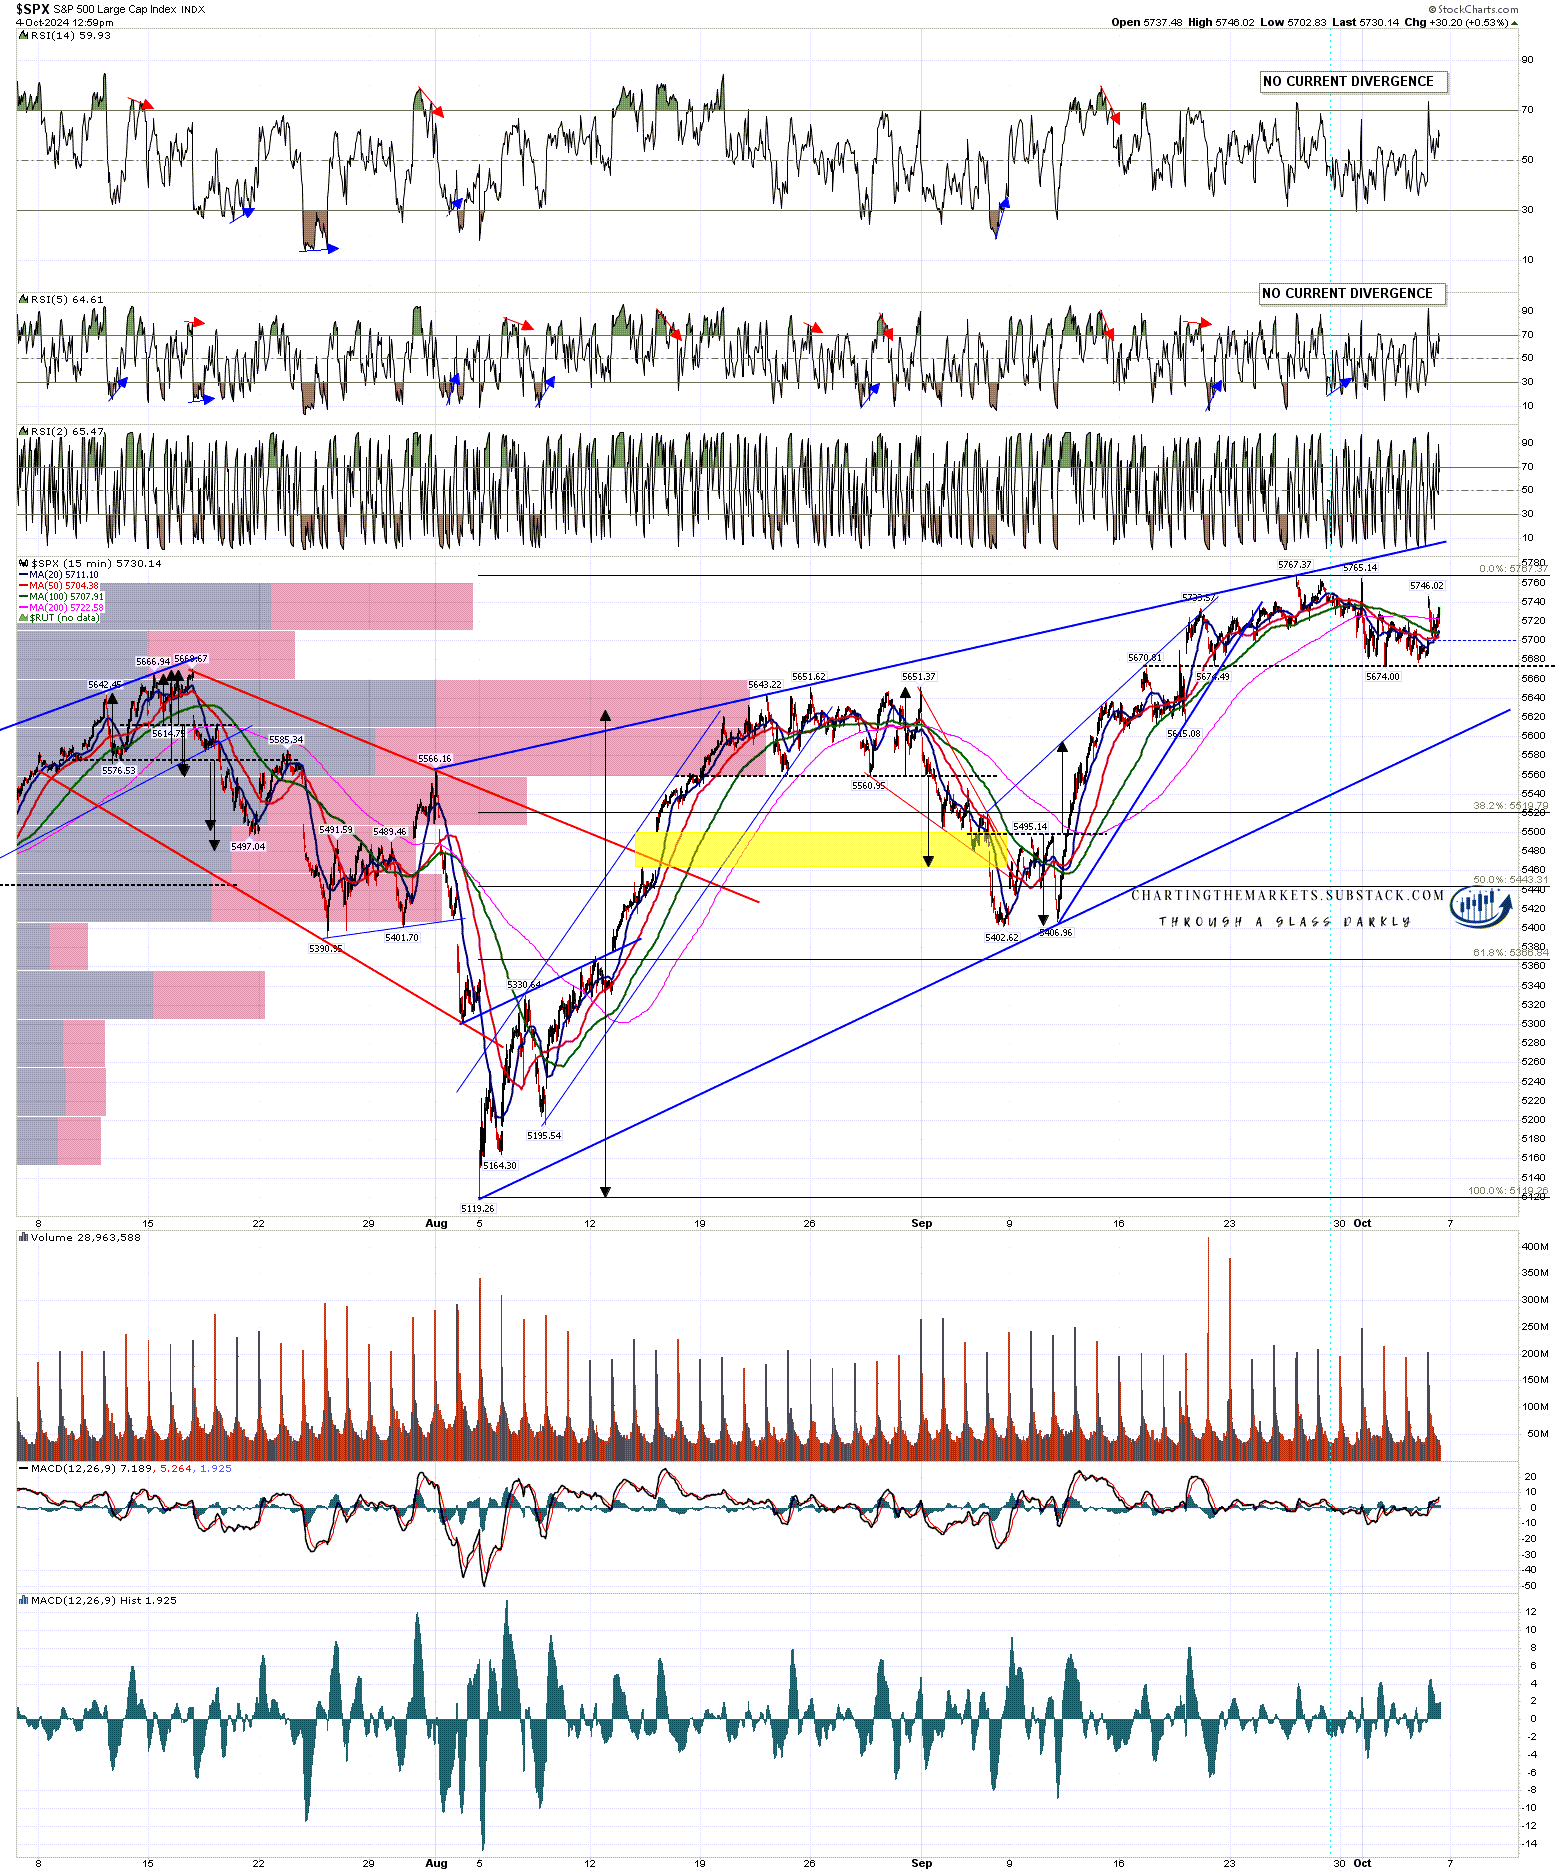
Turning back to the smaller picture I was looking at the possible path in my premarket video yesterday morning, with hourly buy signals fixed or brewing on multiple equity indices and possible H&S patterns forming that would need a right shoulder rally. We are seeing that rally now, and there are some nice looking possible H&S patterns forming here.
Now all of those reached decent areas for those right shoulder highs at the open this morning, and if they go much higher they may retest the prior highs, and in that case these would be possible double top setups, so might still deliver another leg down.
On the SPX 15min chart you can see a very nice short term rising wedge setup from the August low, with wedge support currently in the 5595 area. If the H&S continues to form and breaks down, a sustained break below 5674 would look for the 5583 area. If a double top forms here instead the target level would be slightly lower depending on the level of the second high. The hourly buy signal on ES that I was looking at yesterday morning has already reached target.
SPX 15min chart:
On the Dow chart there is another high quality short term rising wedge that has formed from the August low, with wedge support currently in the 41000 area. A possible upsloping H&S pattern had already formed and broken down, but it looks like a better alternative is forming here with a flat neckline.
If the H&S continues to form and breaks down, a sustained break below 41.8k would look for the 41k area, a strong current match with wedge support. If a double top forms here instead the target level would be slightly lower depending on the level of the second high.
INDU 15min chart:

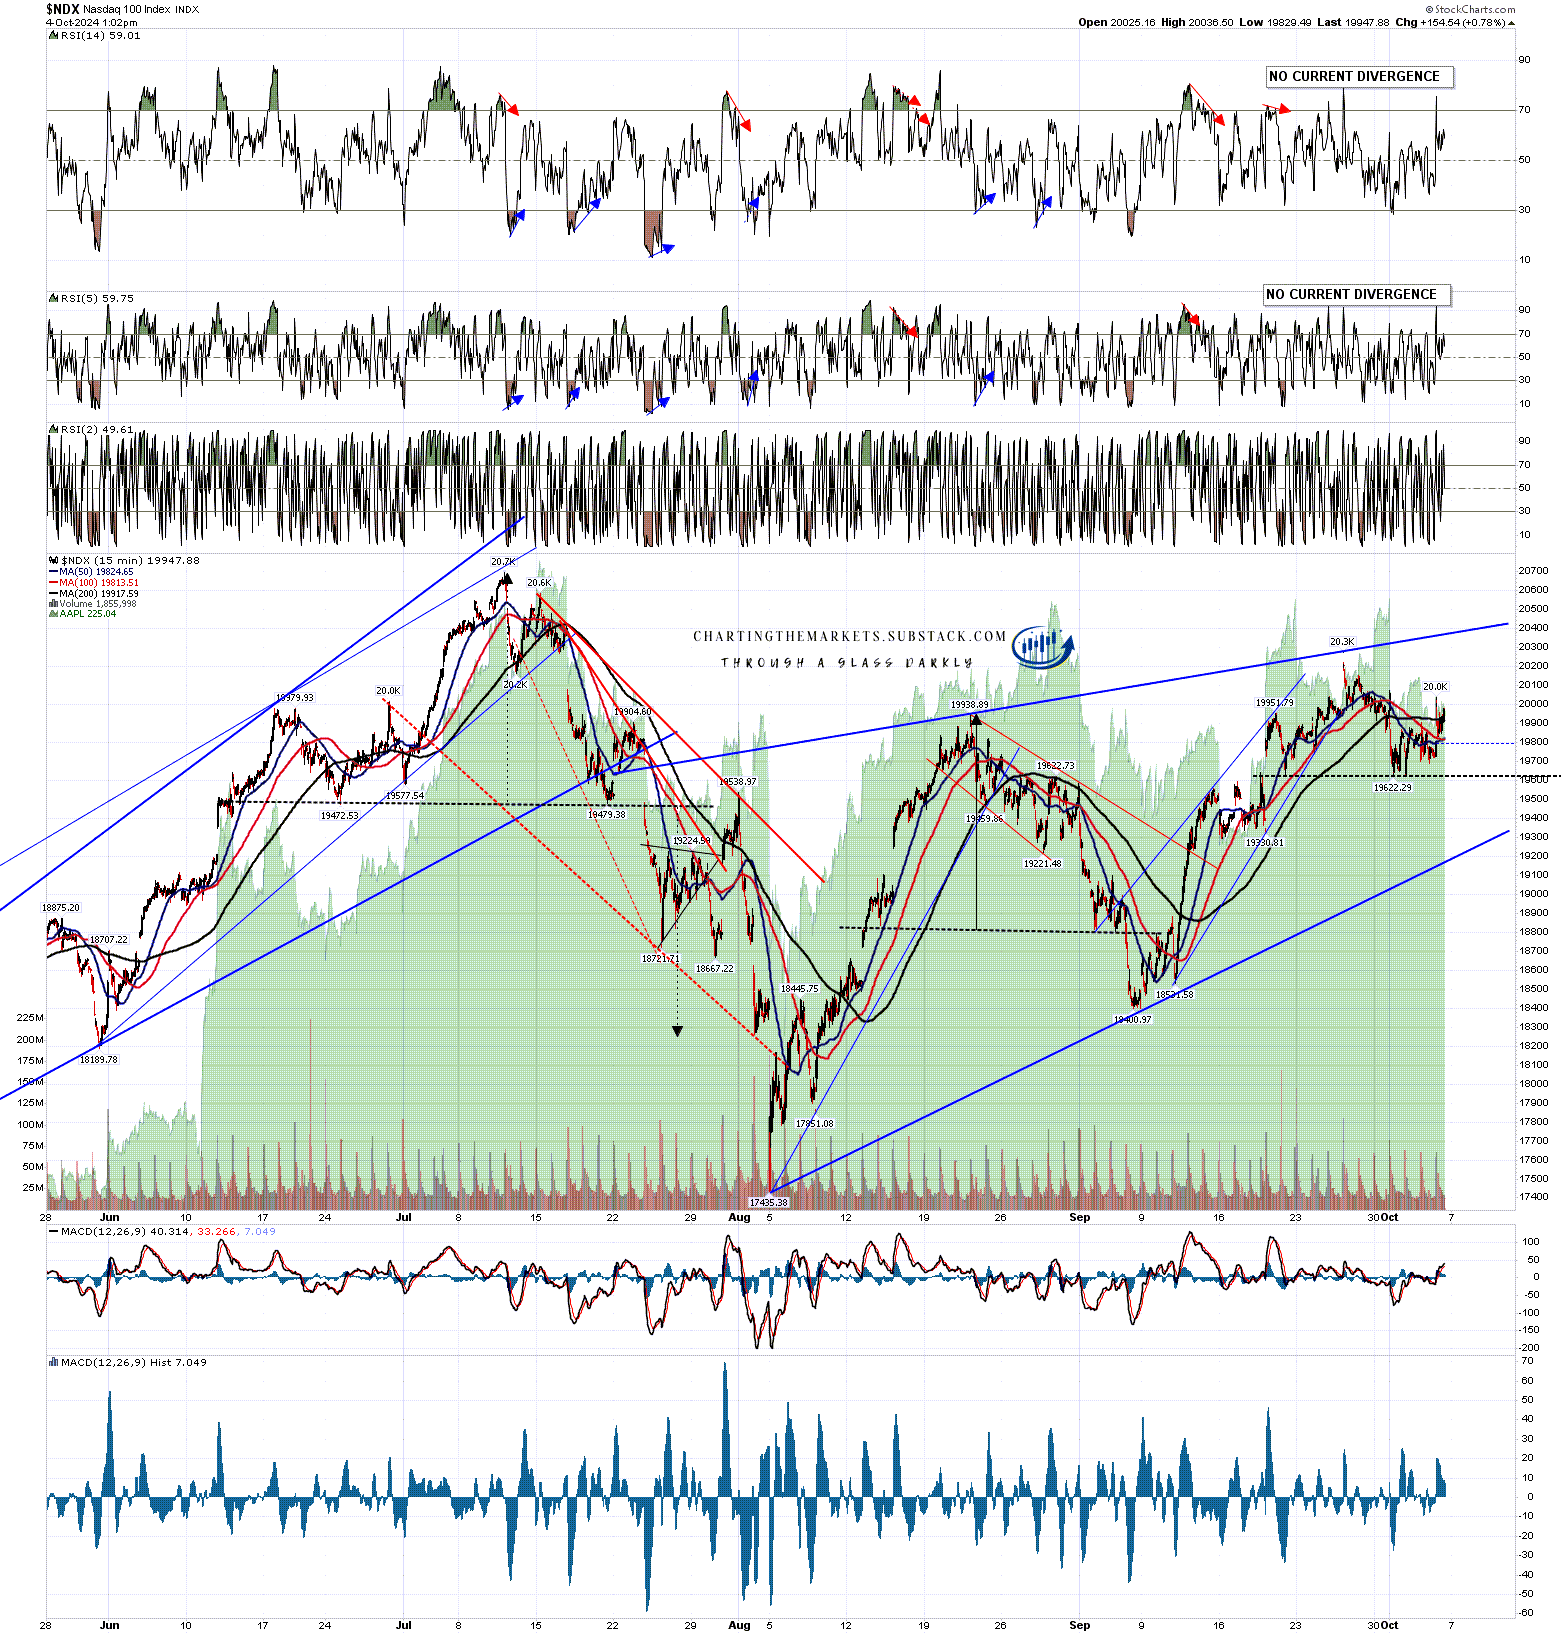
On NDX I don’t have an established pattern from the August low, though rising support from that low is now in the 19,200 area. A good quality possible H&S pattern is also forming there, and if that H&S continues to form and breaks down, a sustained break below 19,622.29 would look for the 18,950 area. If a double top forms here instead the target level would be slightly lower depending on the level of the second high.
NDX 15min chart:
To sum up the open daily RSI 5 sell signals on Dow and SPX are leaning towards more retracement before a decent low can be established for a probable subsequent bull move into Xmas, and that is backed up by the high quality rising wedges formed on Dow and SPX from the August lows. The current rally we are seeing is therefore likely forming H&S right shoulders or, on a break higher, possible double top setups for a larger retracements. We’ll see how that goes.
Everyone have a great weekend! 🙂
If you like my analysis and would like to see more, please take a free subscription at my chartingthemarkets substack, where I publish these posts first and do a short premarket review every morning.
