

Although this post will publish when I’m asleep, and I obviously have no idea what the futures are going to be doing, I wanted to share a few words about each of these index charts.
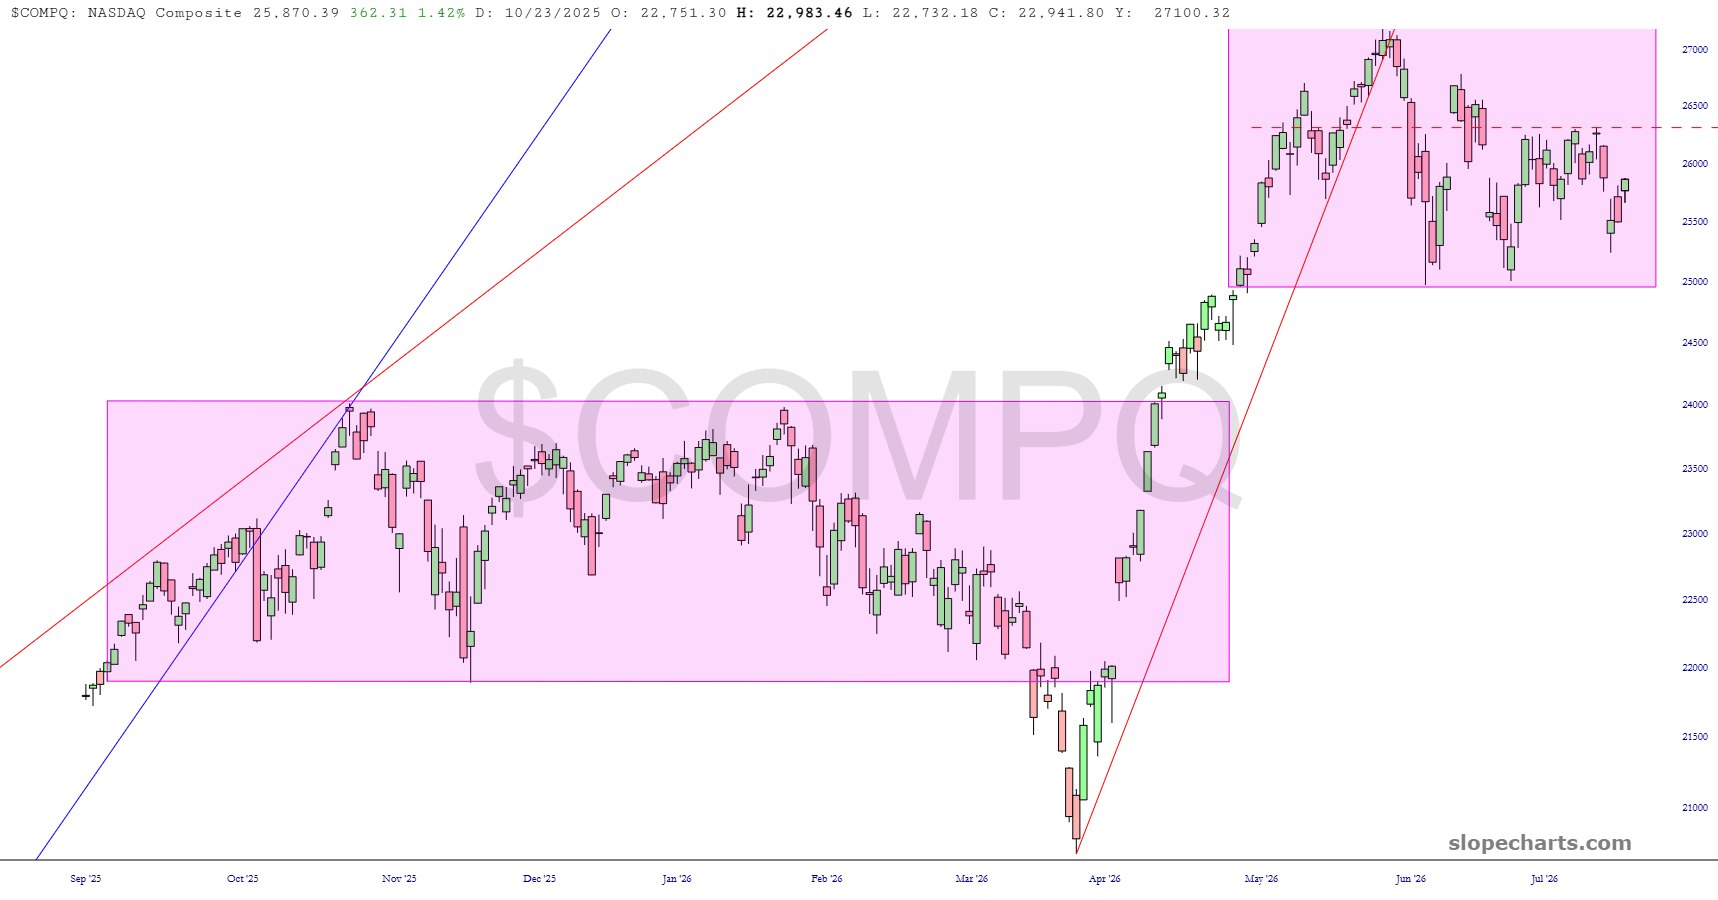
The NASDAQ Composite is still grinding away within a potential reversal pattern. The dashed red line represents the resistance which, if crossed, really harms bearish chances for weeks to come.
The Hang Seng Index, against which I have a short position by way of FXI puts, has almost fully retraced to its broken trendline and is underneath a large zone of overhead supply.

Although the Dow 30 gained almost 500 points during Tuesday’s session, it is still below its broken uptrend, which on its own constitutes the completion of a rising wedge failure.

The oval I’ve drawn over the NASDAQ 100 is there to suggest a diamond pattern, which has complete and, since Friday morning, has been retraced to the failure point.

The crucially important semiconductor index is sporting a quite well-defined topping pattern, although prices are pushing somewhat into the pattern itself.

As for the gold index, I’m not surprised it rallied strongly on Tuesday, and it may well rally a day or two more. The more substantial pattern, however, is the right triangle above it, which will constitute a potent barrier against any meaningful price ascent.

Lastly, the oil index is this close to a lifetime high. Just one decent “up” day on Wednesday will do the trick.

