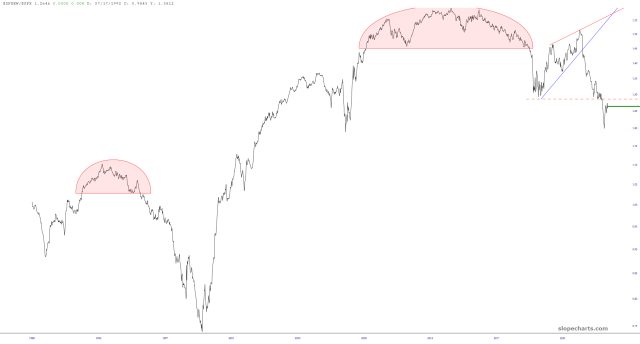
The symbol $SPXEW/$SPX is a ratio chart which divides the equal-weighted S&P 500 by the “normal” oh-so-heavily weighted S&P 500. It illustrates market breadth. In a perfect world, it would be a flat line, showing that all 500 stocks were moving up and down perfectly together. Instead, the ratio chart shows a severely degrading situation, emphasizing the eroding breadth of the market.
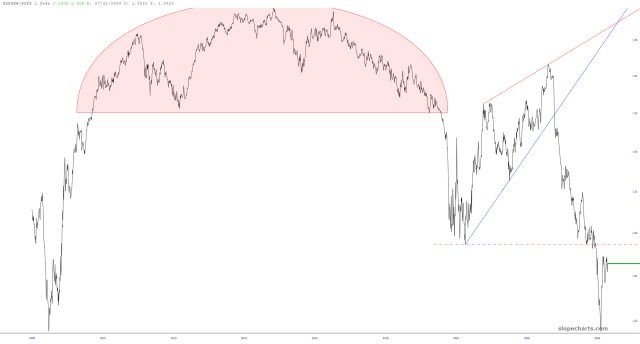
Looking at the larger picture you can see that, yes, we’ve had a hearty bounce in recent weeks, but it is approaching major resistance. Even though this isn’t a tradeable instrument per se, I believe the basic technical analysis techniques are still germane.